Many traders struggle not because they lack indicators, but because they use them without a clear role . Some depend on just one indicator and get trapped by false signals. Others overload their charts and end up frozen by contradiction.
The solution is not more tools — it’s better coordination .
When RSI, MACD, Stochastic, and Bollinger Bands are used together correctly, they form a structured decision-making framework that improves clarity, timing, and confidence.
This article will show you how to do exactly that — in simple language, without theory overload.
 This creates entries closer to balance, not exhaustion.
 When Bollinger behavior agrees with RSI, MACD, and Stochastic, the setup becomes clearer.
Why Combining Indicators Matters
Every indicator is built from price, but each one interprets price differently:- Some focus on direction
- Some focus on strength
- Some focus on position
- Some focus on market activity
- Is the market trending or resting?
- Is momentum strong or fading?
- Is price stretched or balanced?
- Is this a good moment to act or wait?
The Role of Each Indicator (In Plain Language)
Before combining indicators, you must understand what job each one does .RSI — Momentum Health Check
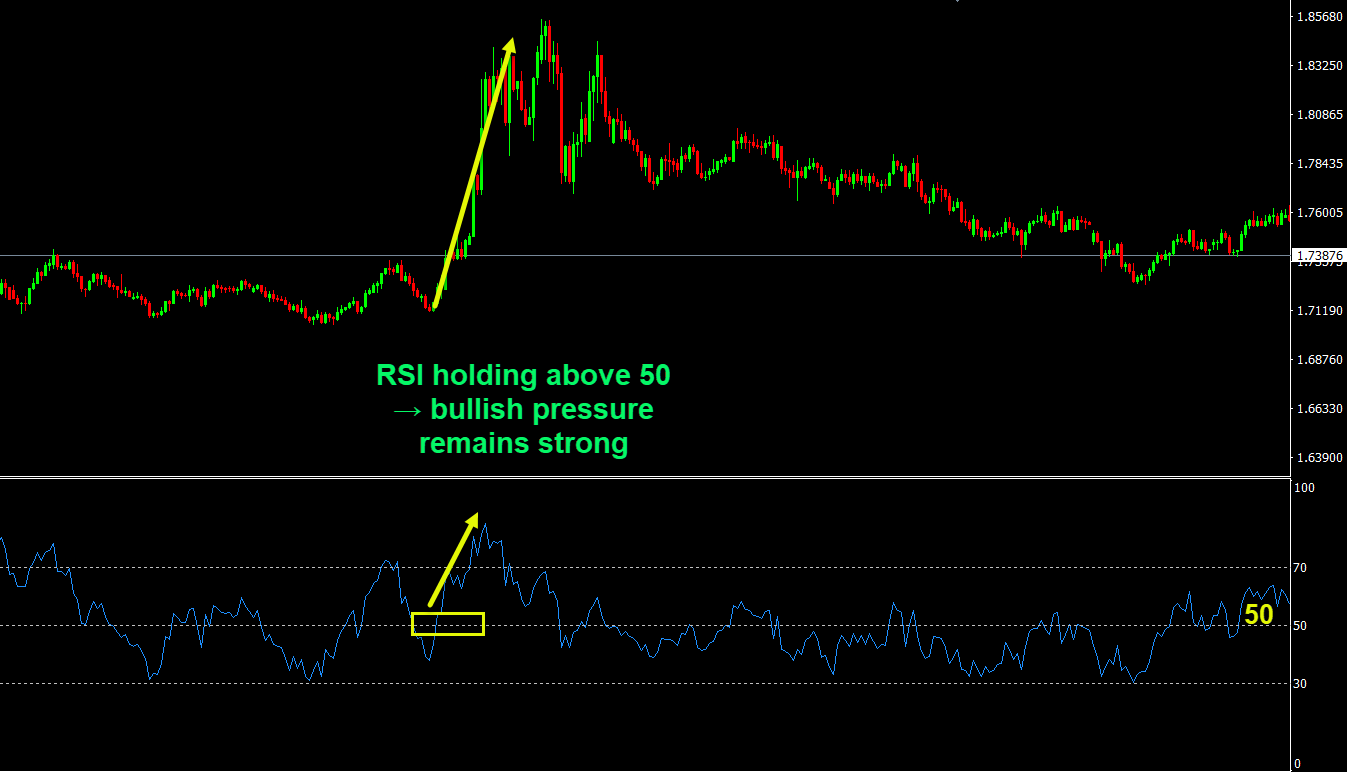
RSI helps you understand who is in control of the market right now.- RSI holding above the midpoint (50 Level) shows buyers have the advantage
- RSI staying below the midpoint (50 Level) shows sellers are dominant

- Very high or very low readings suggest price has moved aggressively
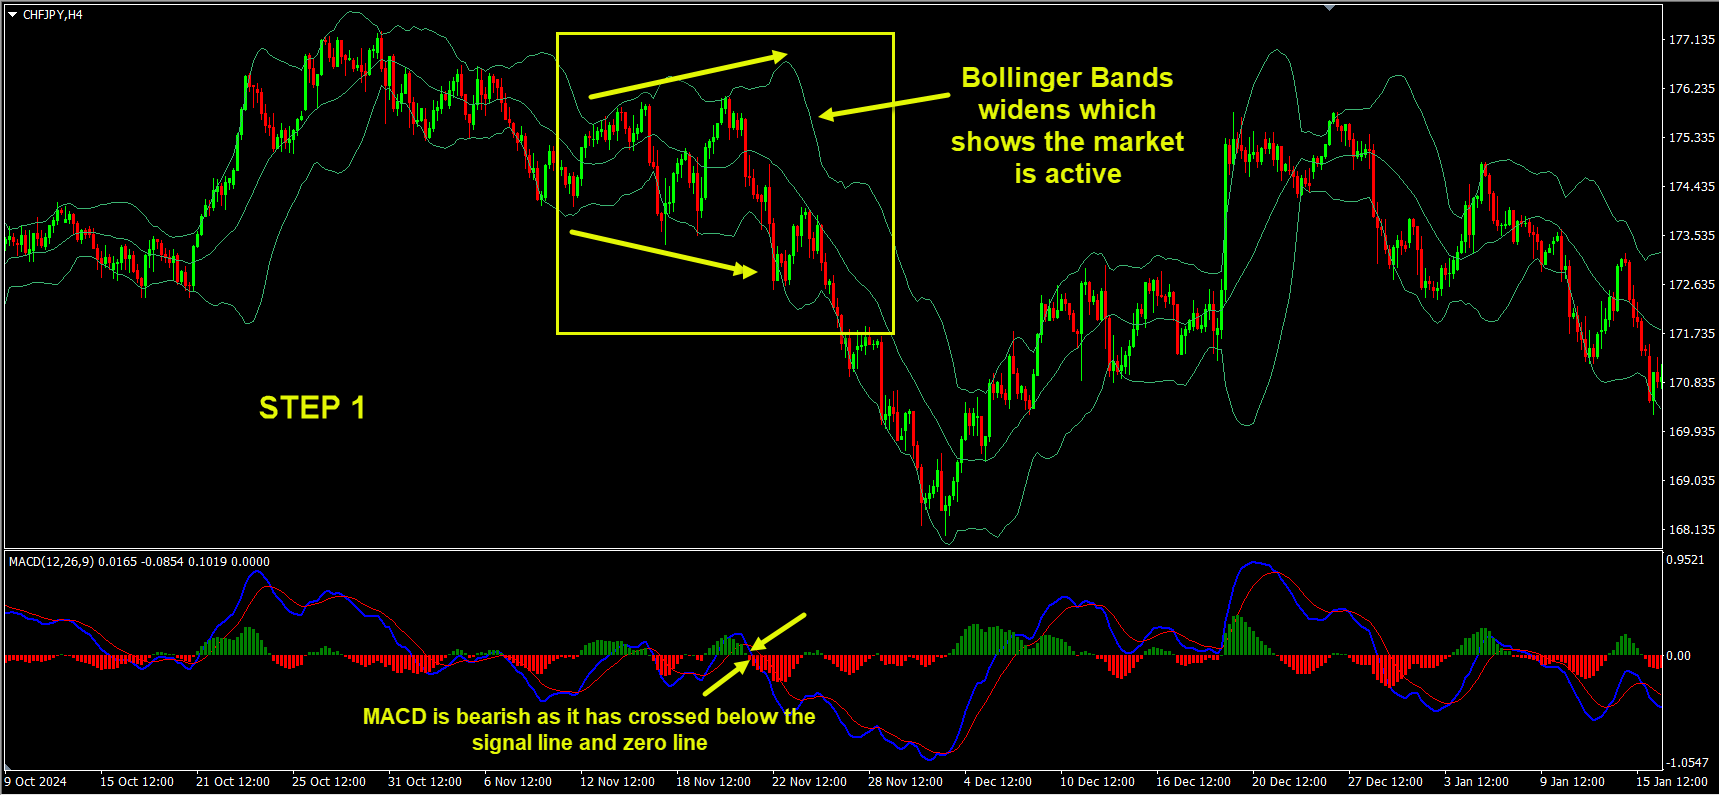
MACD — Direction and Momentum Shift Detector
MACD compares short-term and longer-term price behavior. It helps answer: 👉 Is momentum increasing in this direction, or weakening?- MACD above its signal and above the zeroline → bullish environment

- MACD below its signal and below the zeroline → bearish environment

Stochastic — Timing Tool
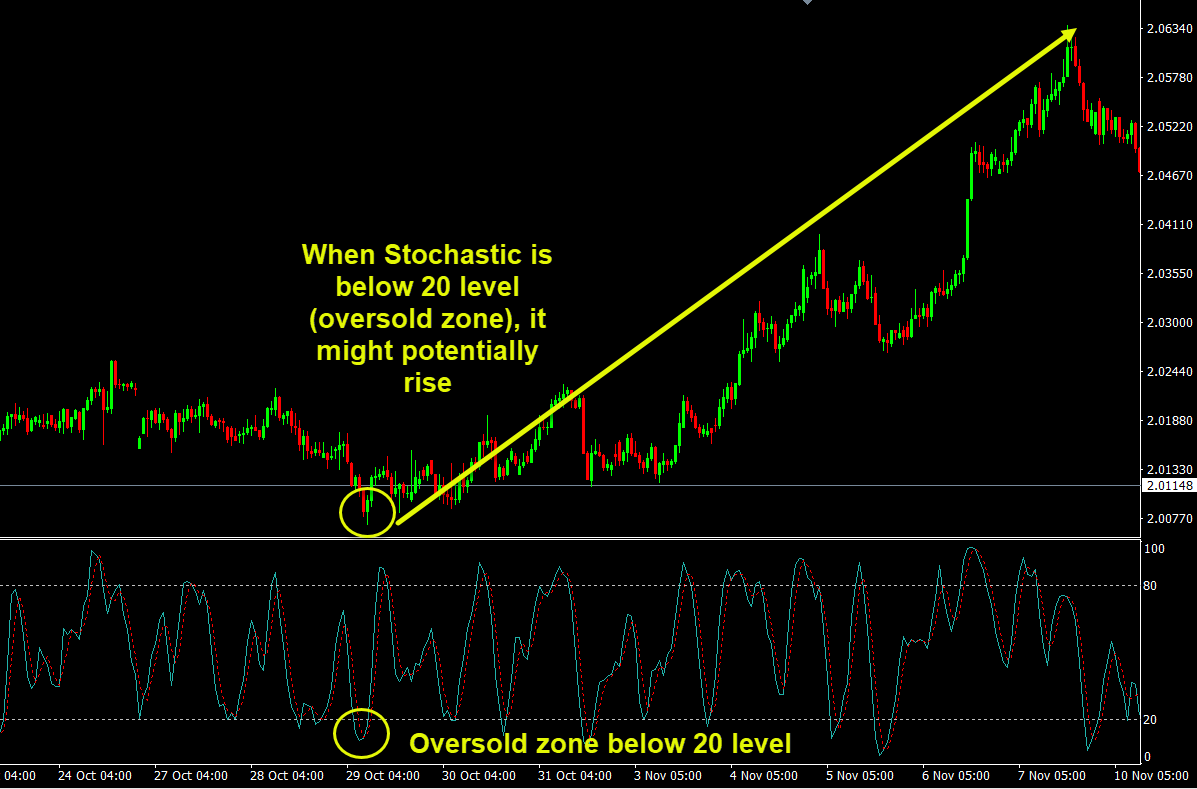
Stochastic shows where price is trading inside its recent range .- When Stochastic is below 20 level (oversold zone), it might potentially rise
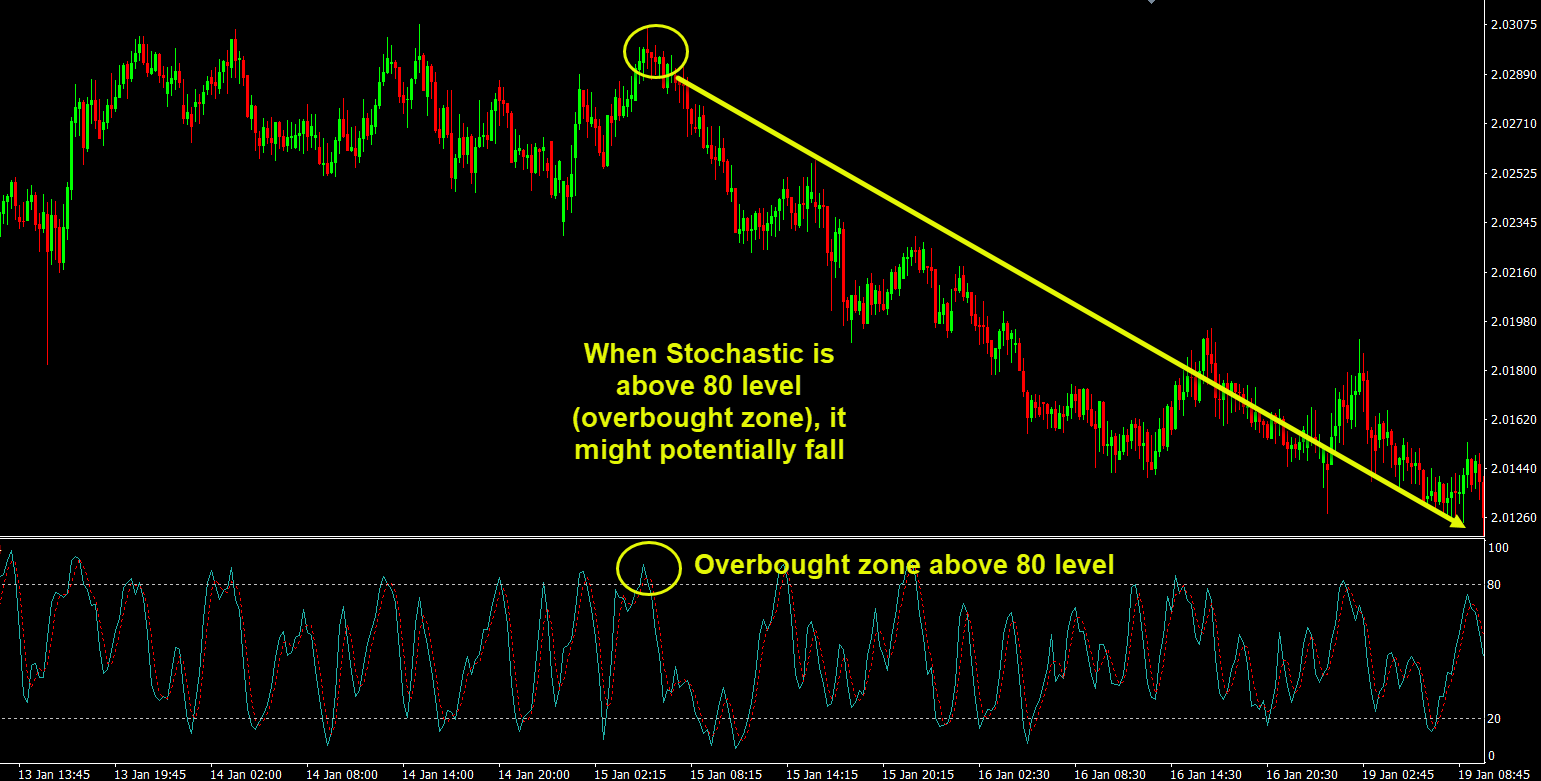
- When Stochastic is above 80 level (overbought zone), it might potentially fall
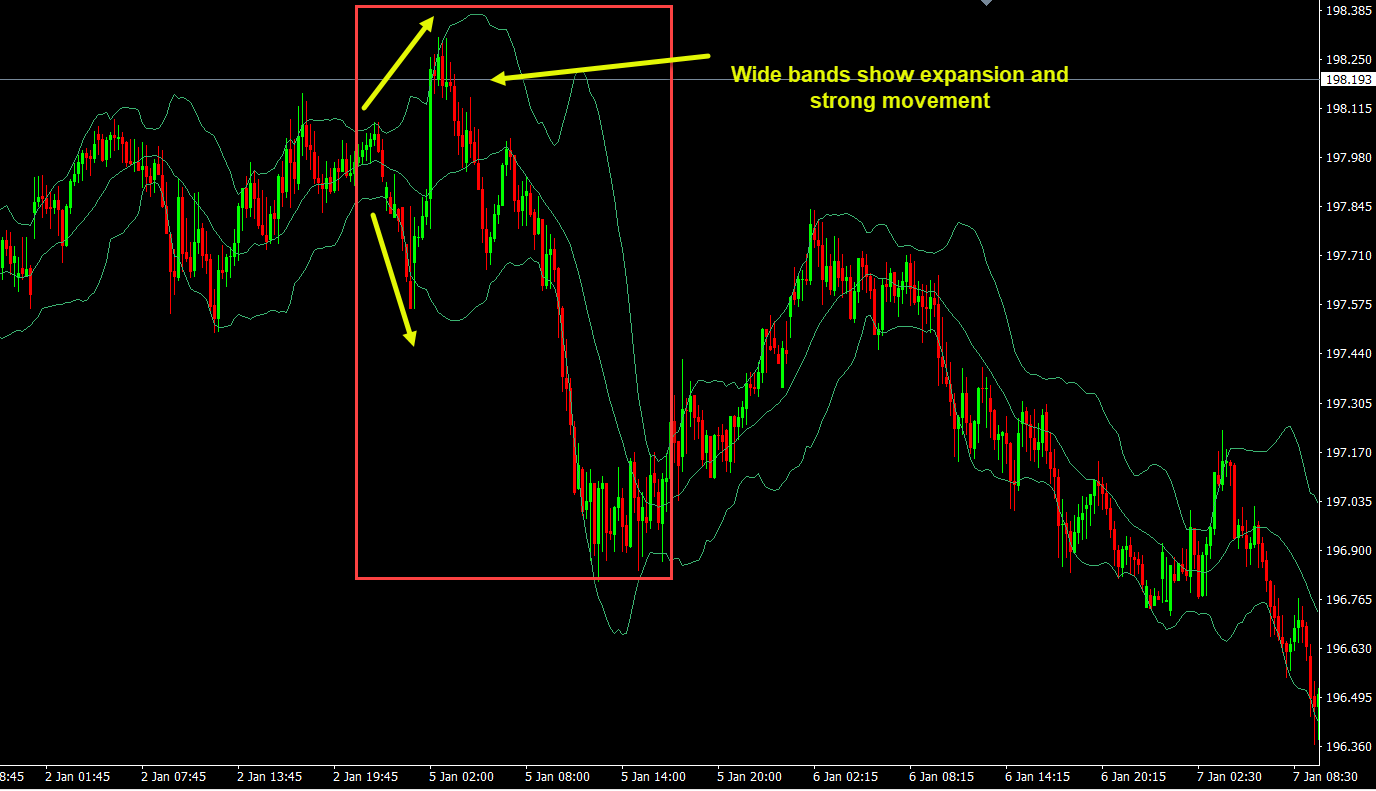
Bollinger Bands — Market Activity & Price Balance
Bollinger Bands adapt to volatility.- Narrow bands show compression and low activity
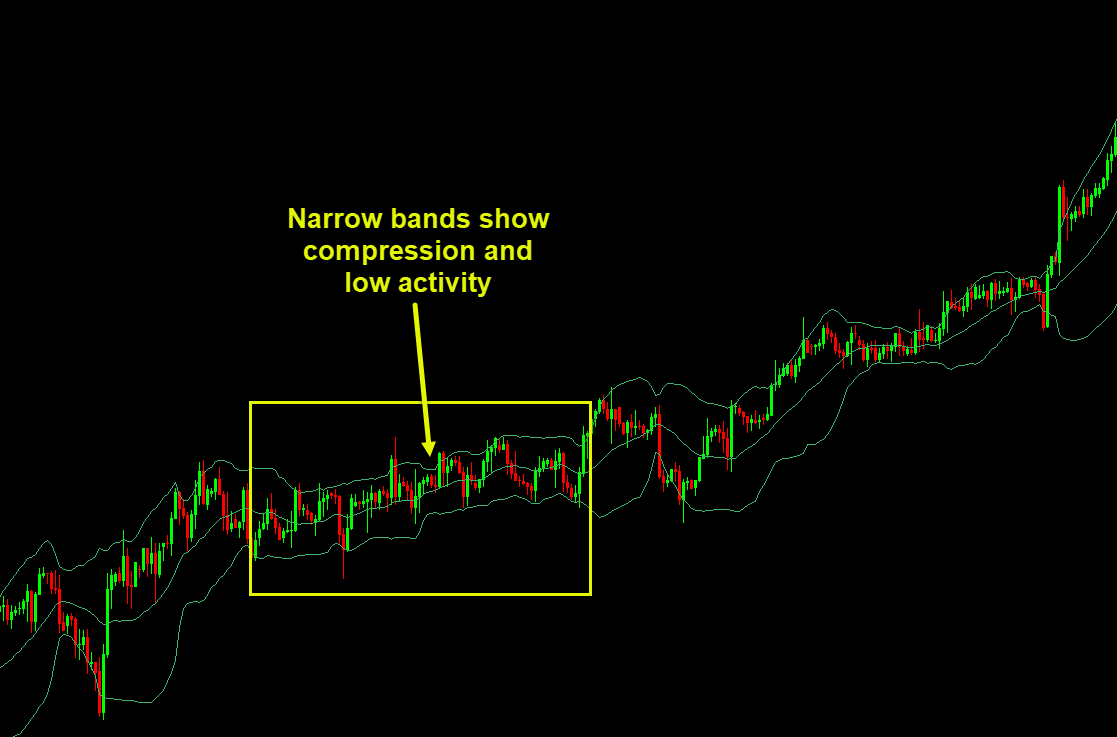
- Wide bands show expansion and strong movement
Why This Combination Works
Each indicator covers a different dimension of the market:- MACD → market direction
- RSI → momentum strength
- Stochastic → timing
- Bollinger Bands → volatility and price positioning
A Structured Way to Combine Them
Rather than reacting to every signal, use a sequence-based approach .Step 1 — Establish Market Environment
Start with MACD and Bollinger Bands.- MACD shows whether the market has a bullish or bearish bias
- Bollinger Bands show whether the market is quiet or active
- Is momentum aligned with direction?
- Is volatility expanding or contracting?
Step 2 — Confirm Strength with RSI
Once direction is clear, RSI acts as a filter.- In bullish conditions, RSI should remain above its midpoint (50 Level)
- In bearish conditions, RSI should remain below its midpoint (50 Level)

Step 3 — Wait for Entry Timing with Stochastic
Now you wait. Stochastic helps you avoid chasing price:- In an uptrend, wait for price to pullback and Stochastic to reach oversold zone below 20 level
- In a downtrend, wait for price to pullback and Stochastic to reach overbought zone above 80 level
This creates entries closer to balance, not exhaustion.
Step 4 — Validate with Bollinger Band Behavior
Before entering, check price interaction with the bands:- Pullbacks toward the middle line often act as continuation zones
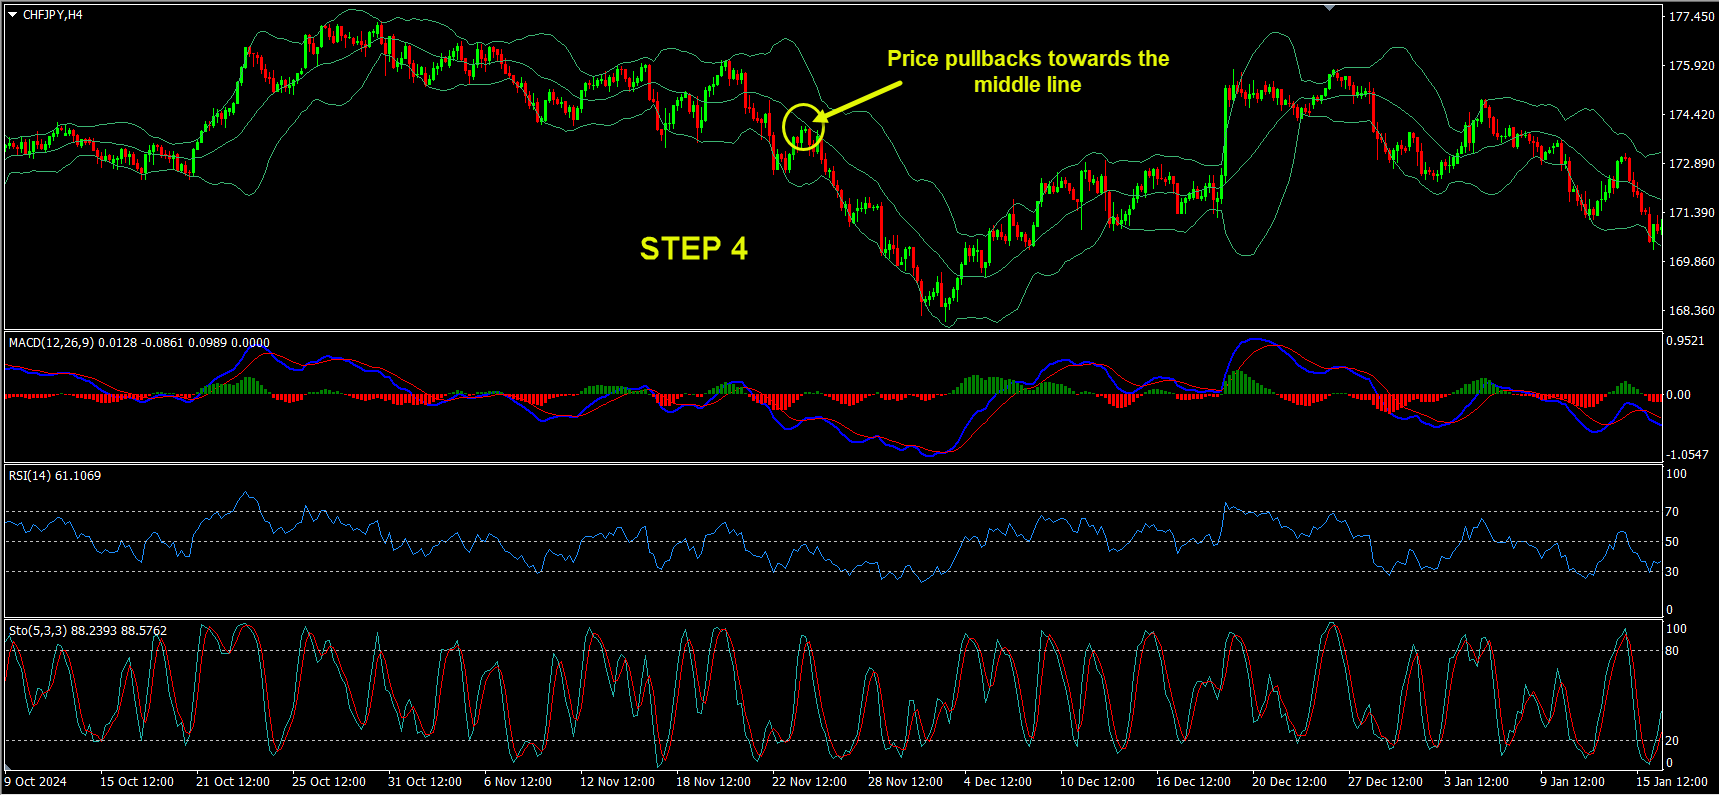
When Bollinger behavior agrees with RSI, MACD, and Stochastic, the setup becomes clearer.
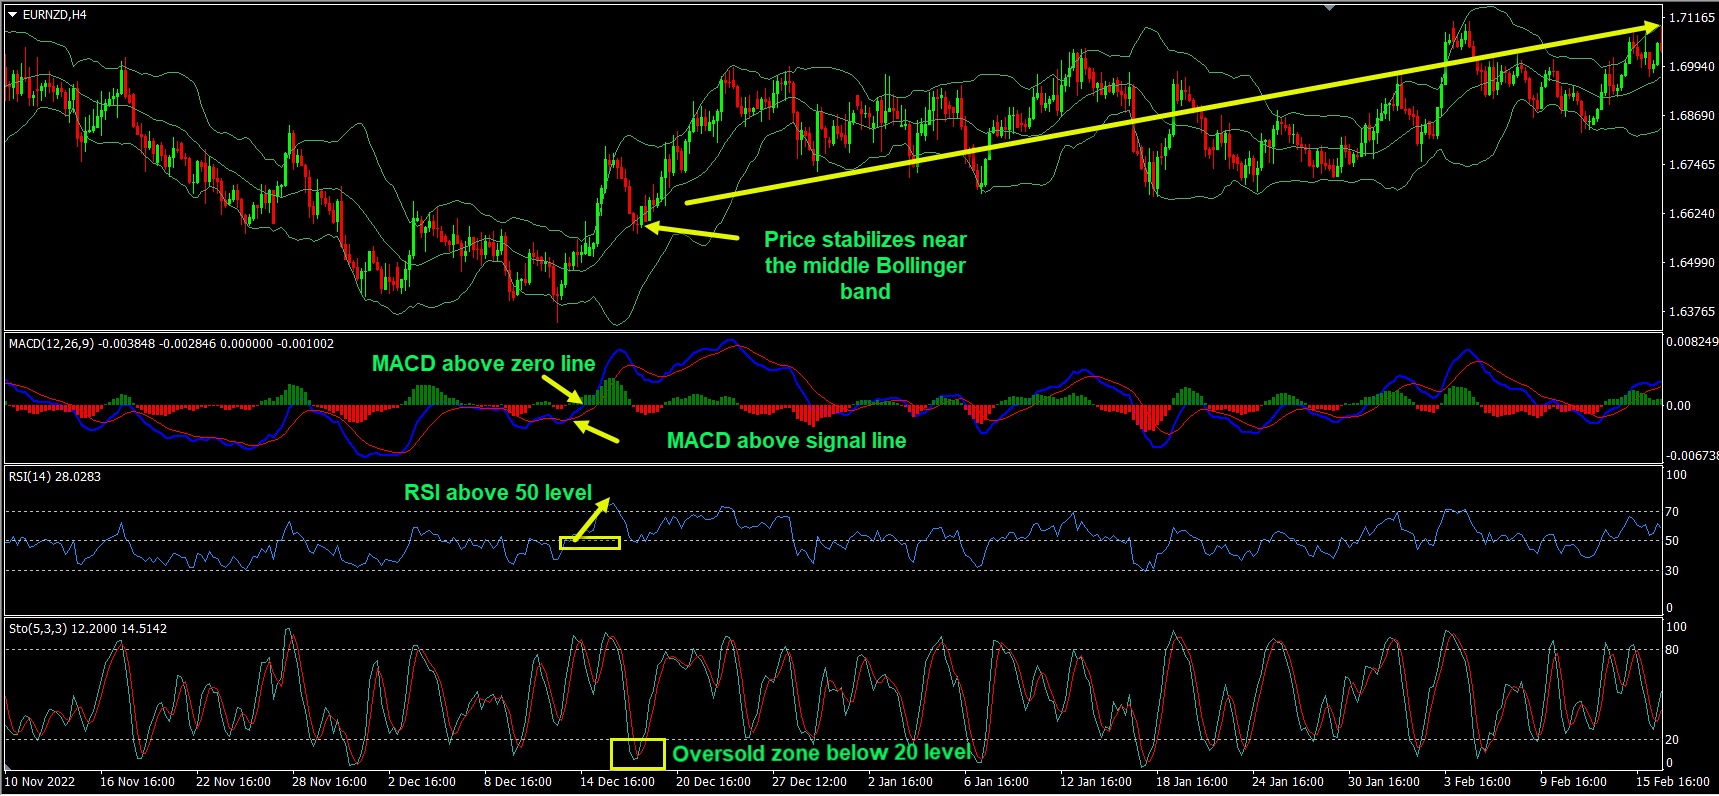
Example Trade Logic (With Charts)
Buy Strategy
- MACD confirms bullish conditions
- RSI holds above its midpoint
- Price pulls back modestly
- Stochastic reaches oversold zone
- Price stabilizes near the middle Bollinger band
Sell Strategy
- MACD confirms bearish conditions
- RSI stays below its midpoint (50 Level)
- Price makes a corrective rally
- Stochastic reaches overbought zone
- Price reacts near the middle Bollinger band

Mistakes That Destroy Good Indicator Combinations
Even strong tools fail when used poorly.❌ Acting on the First Signal
One indicator firing alone is not a setup.❌ Ignoring Market Structure
Indicators do not replace support and resistance.❌ Overtrading Every Crossover
Not all signals deserve action. Discipline matters more than precision.Why This Approach Builds Consistency
This method doesn’t predict. It filters . It helps you:- Avoid low-quality trades
- Enter with context
- Stay aligned with market conditions
- Reduce emotional decision-making