Understanding price action is the foundation of good trading. But sometimes price doesn’t tell you the whole story on its own. That’s where indicators like Bollinger Bands come in — not to replace price action, but to clarify what’s happening beneath the surface.
Bollinger Bands are among the most insightful tools in a Forex trader’s toolkit. They help you see volatility, trend strength, and potential reversal areas — all in a single glance.
Let’s break Bollinger Bands down in easy language, without the noise.
 🔹 Middle Line: A simple moving average (usually 20 periods)🔹 Upper Band: Above the moving average by a set number of standard deviations🔹 Lower Band: Below the moving average by the same number of standard deviations
Standard deviation is just a fancy statistical term — all it means here is how stretched price is away from its average.
So:
🔹 Middle Line: A simple moving average (usually 20 periods)🔹 Upper Band: Above the moving average by a set number of standard deviations🔹 Lower Band: Below the moving average by the same number of standard deviations
Standard deviation is just a fancy statistical term — all it means here is how stretched price is away from its average.
So:

 Volatility matters because it influences how you size positions, where you place stops, and when you choose to enter or exit.
 Think of this like a coiled spring.
➡️ Tight bands often precede strong moves. But remember, the squeeze doesn’t tell you which direction price will break — only that pressure is building.
How to trade a breakout after the bands squeeze:
Think of this like a coiled spring.
➡️ Tight bands often precede strong moves. But remember, the squeeze doesn’t tell you which direction price will break — only that pressure is building.
How to trade a breakout after the bands squeeze:
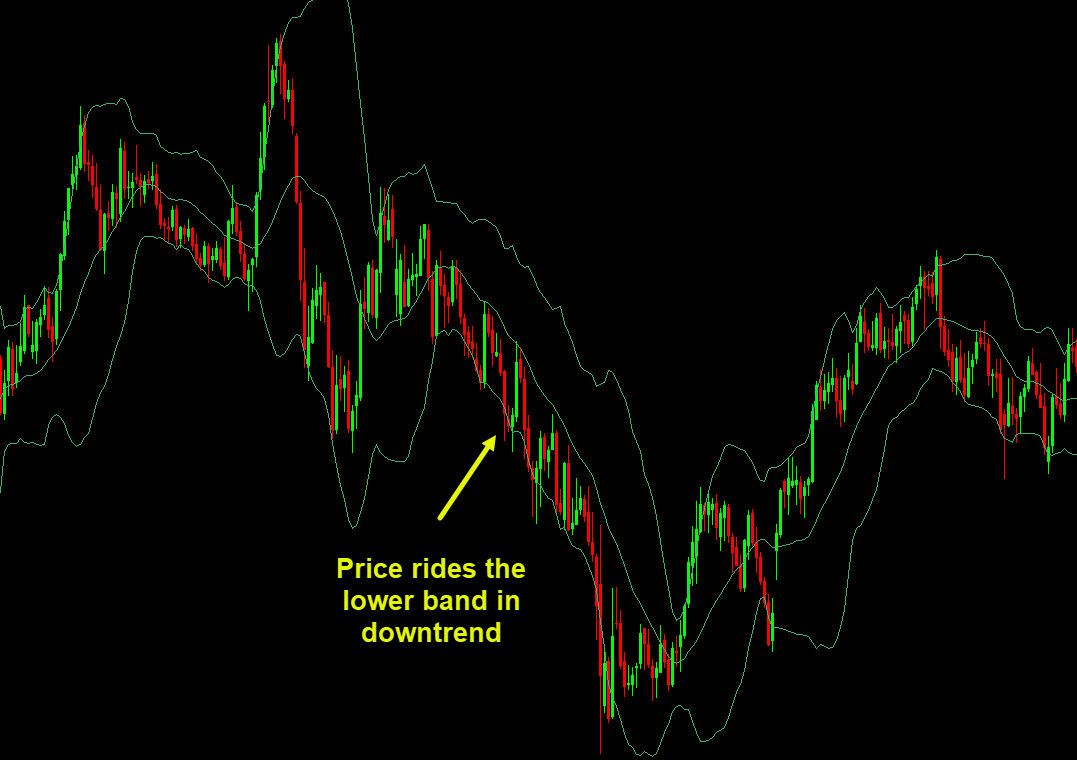
 ✔️ Price will ride the lower band in a downtrend
 This is NOT random. It reflects consistent directional force.
If price keeps hitting the band like a dog chasing a stick, momentum is intact.
This is NOT random. It reflects consistent directional force.
If price keeps hitting the band like a dog chasing a stick, momentum is intact.
 This doesn’t guarantee reversal — but it increases the odds of a pause or correction . Extra Tips
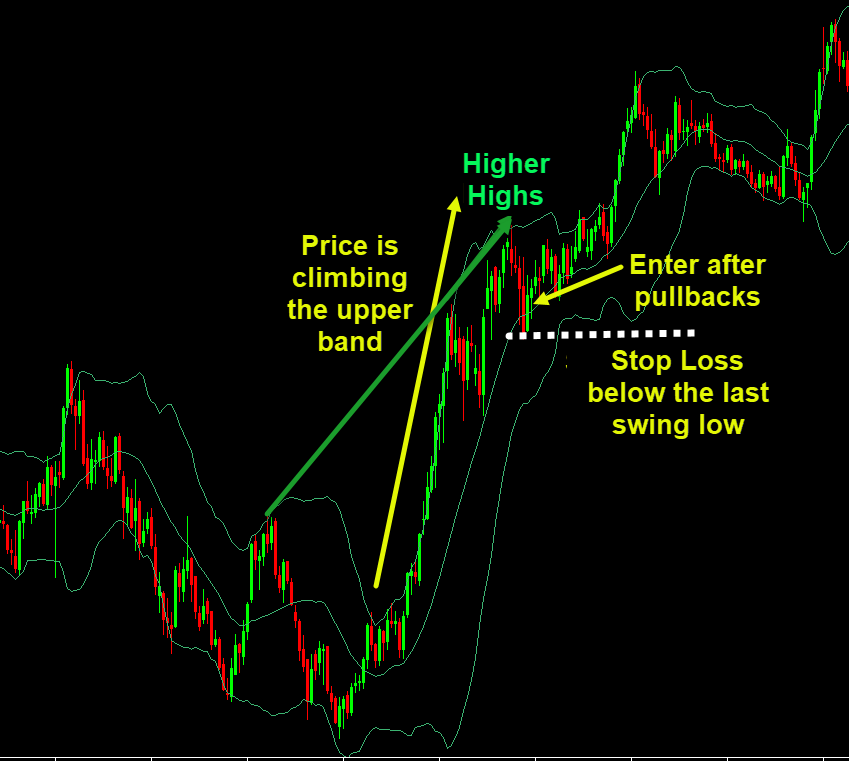 If price is climbing the upper band and forming higher highs, the trend is likely strong. Enter after pullback and place the stop loss below the last swing low.
Use this info to:
If price is climbing the upper band and forming higher highs, the trend is likely strong. Enter after pullback and place the stop loss below the last swing low.
Use this info to:
What Are Bollinger Bands?
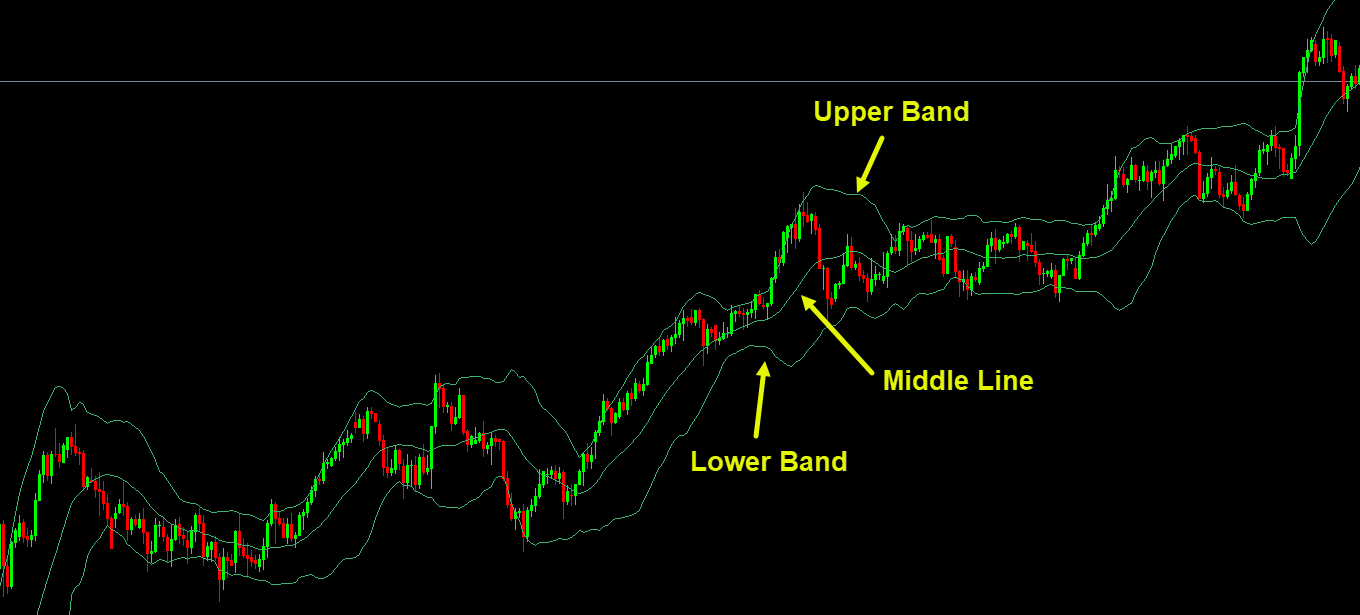
Imagine price moving inside a flexible channel that expands and contracts depending on how wild price swings are. That’s basically what Bollinger Bands are. They consist of three lines drawn on your chart:
🔹 Middle Line: A simple moving average (usually 20 periods)🔹 Upper Band: Above the moving average by a set number of standard deviations🔹 Lower Band: Below the moving average by the same number of standard deviations
Standard deviation is just a fancy statistical term — all it means here is how stretched price is away from its average.
So:
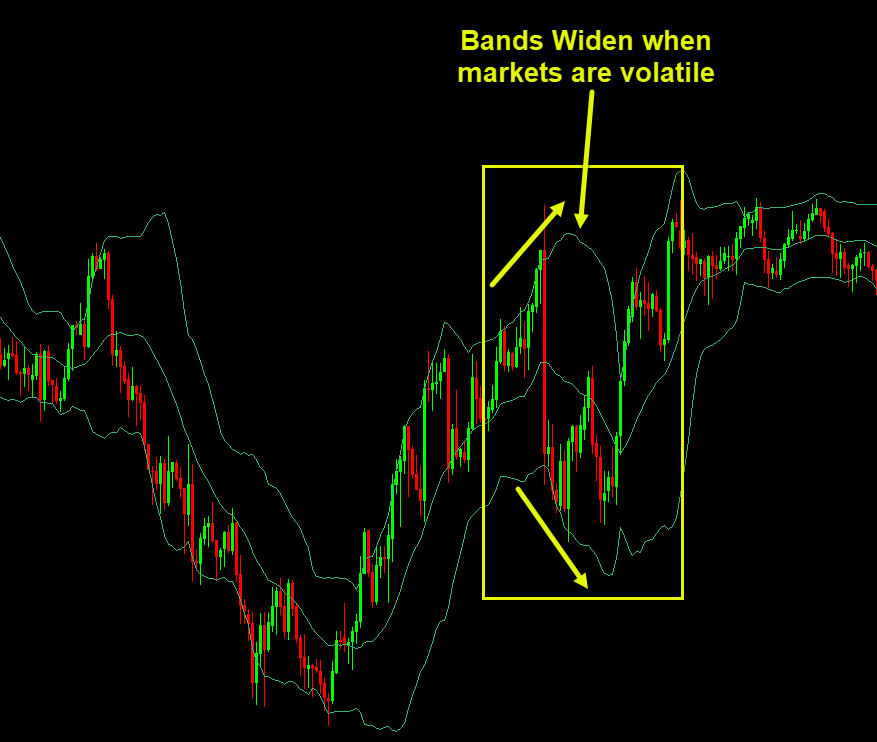
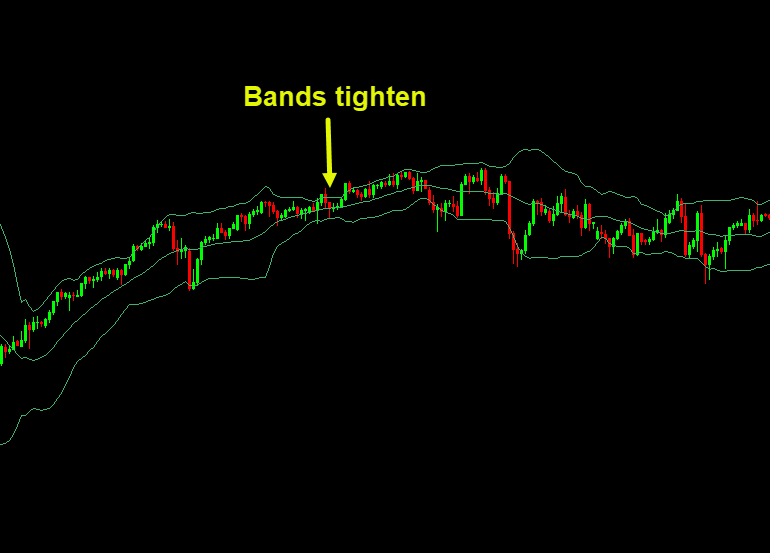
- When markets are calm → the bands tighten
- When markets are volatile → the bands widen

Why Bollinger Bands Matter
There are two big pieces of information Bollinger Bands give us:1. Volatility Awareness
Instead of guessing whether the market is quiet or noisy, Bollinger Bands show it visually:✔️ Tight bands → low volatility (range or consolidation)
✔️ Wide bands → high volatility (trend or breakout
Volatility matters because it influences how you size positions, where you place stops, and when you choose to enter or exit.
2. Acts as Dynamic Resistance and Support Levels
Bollinger Bands don’t act like fixed horizontal levels. Instead, they move with price and volatility , which is why they’re called dynamic support and resistance.How it works
Upper Band — Temporary Resistance
- When price touches the upper band, it signals possible short-term downside extension .
- Sellers may step in, causing a pause or bounce .
- This resistance is temporary , not a fixed floor.
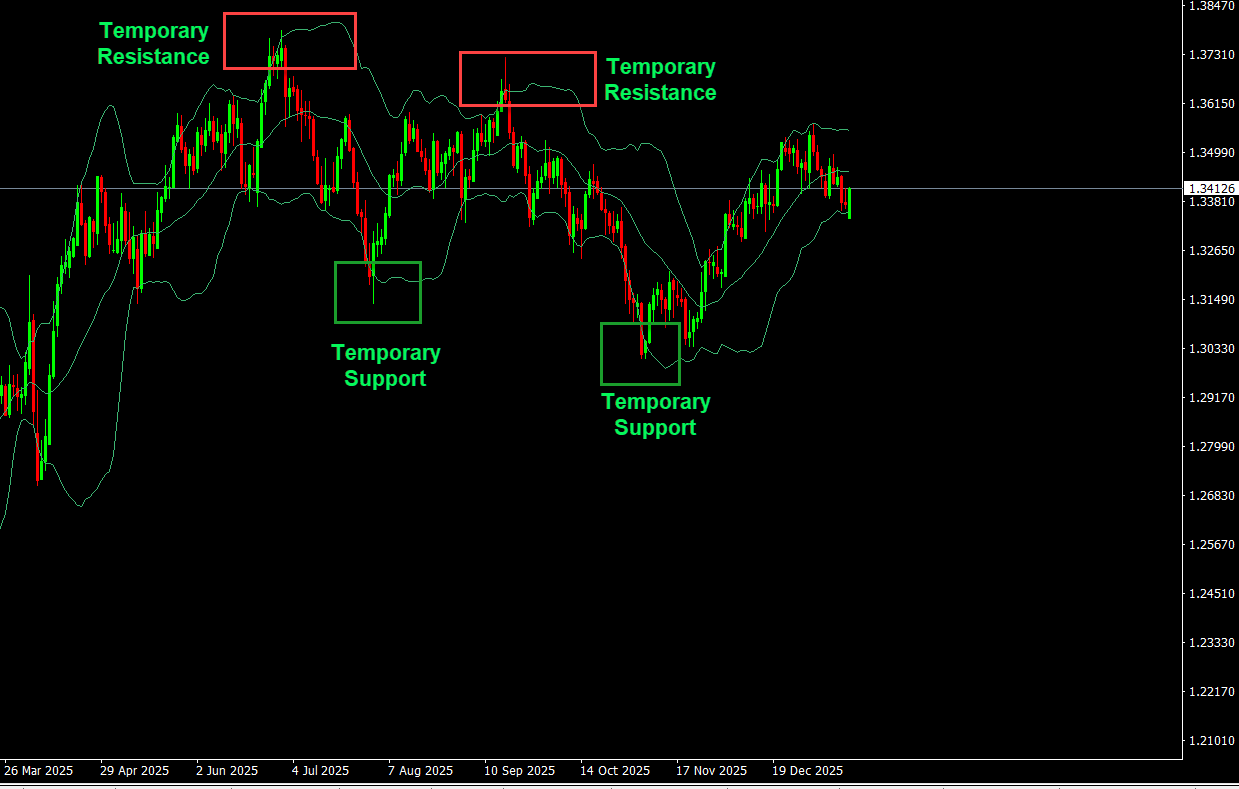 Lower Band — Temporary Support
 - When price touches the lower band, it signals possible short-term upside extension .
- Buyers may step in, causing a pause or bounce .
- This support is temporary , not a fixed floor.
How to Read Bollinger Bands
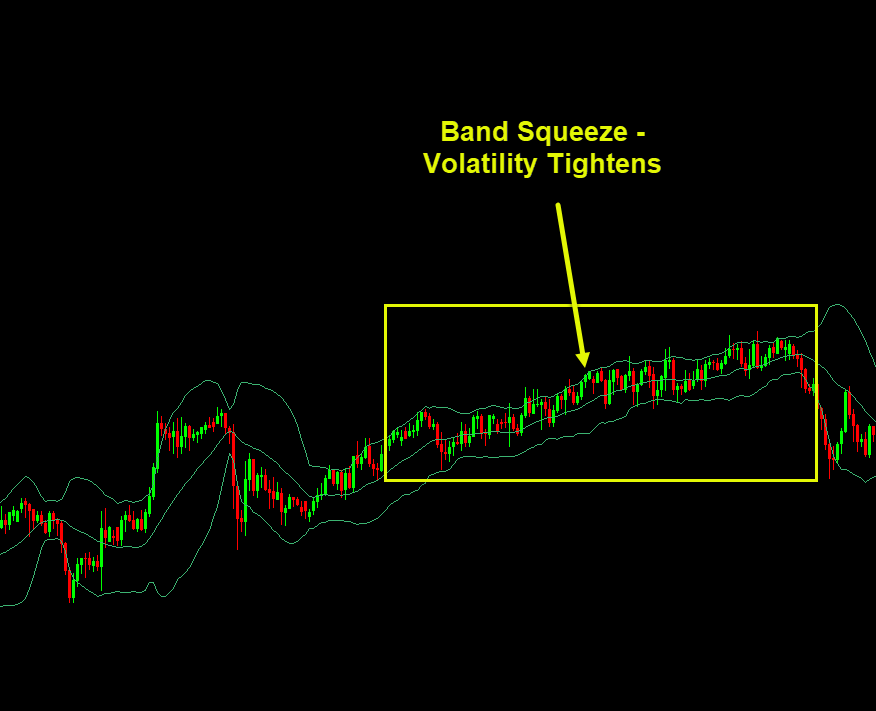
Let’s remove ambiguity and focus on what matters in real trading:1. Band Squeeze — Volatility Tightens
When the bands draw in close together, it’s a sign the market is resting — not directional yet.
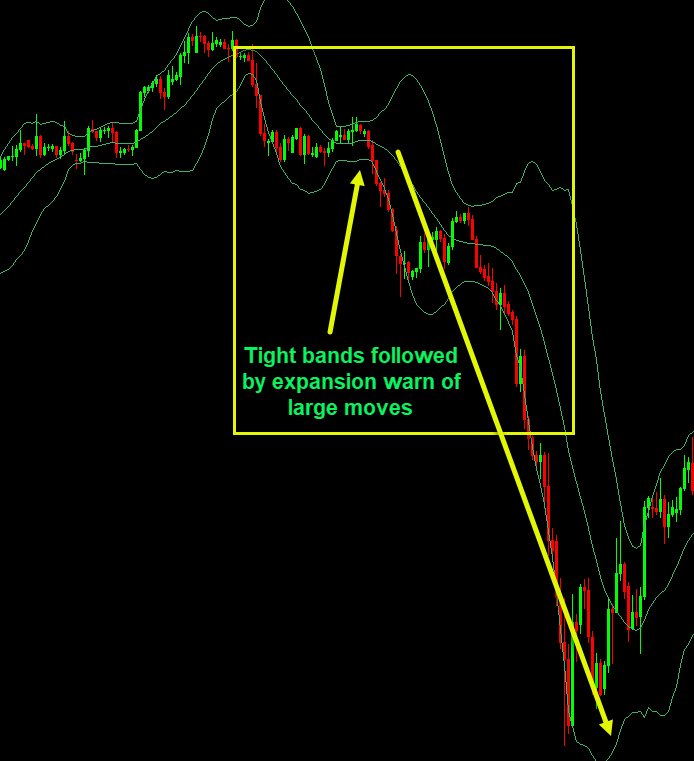
Think of this like a coiled spring.
➡️ Tight bands often precede strong moves. But remember, the squeeze doesn’t tell you which direction price will break — only that pressure is building.
How to trade a breakout after the bands squeeze:
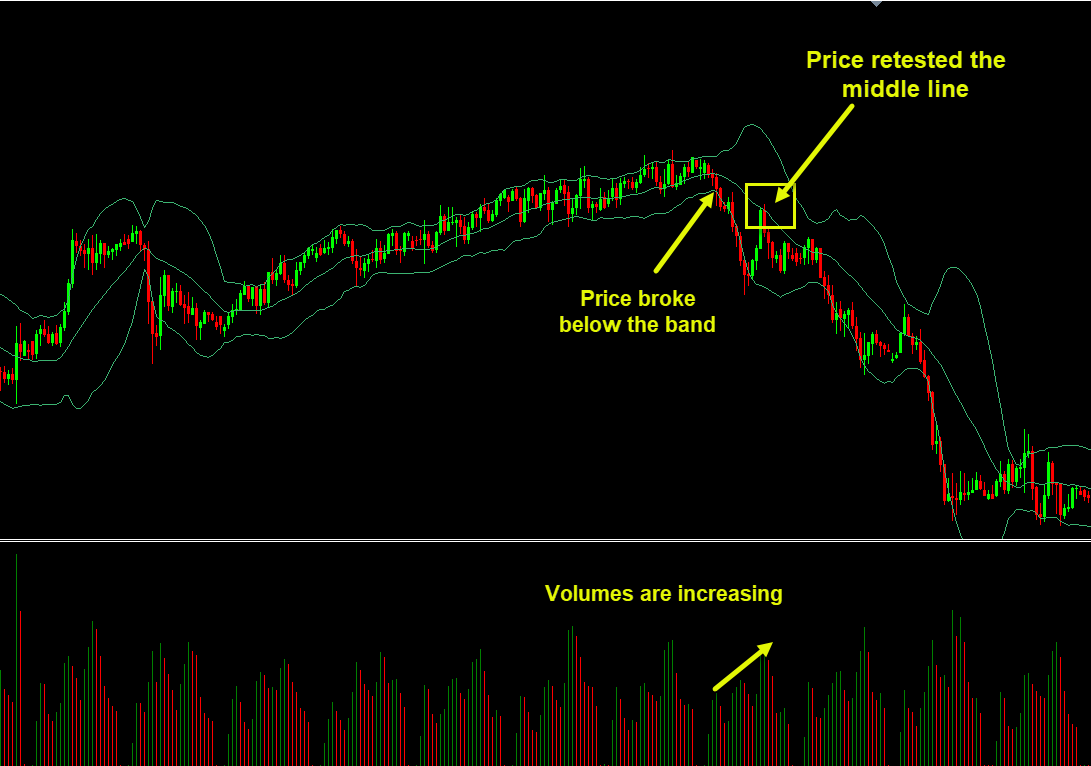
- Wait for a breakout candle above or below the bands
- Confirm with volume or momentum
- Wait for the price to retest the middle line for a cleaner entry
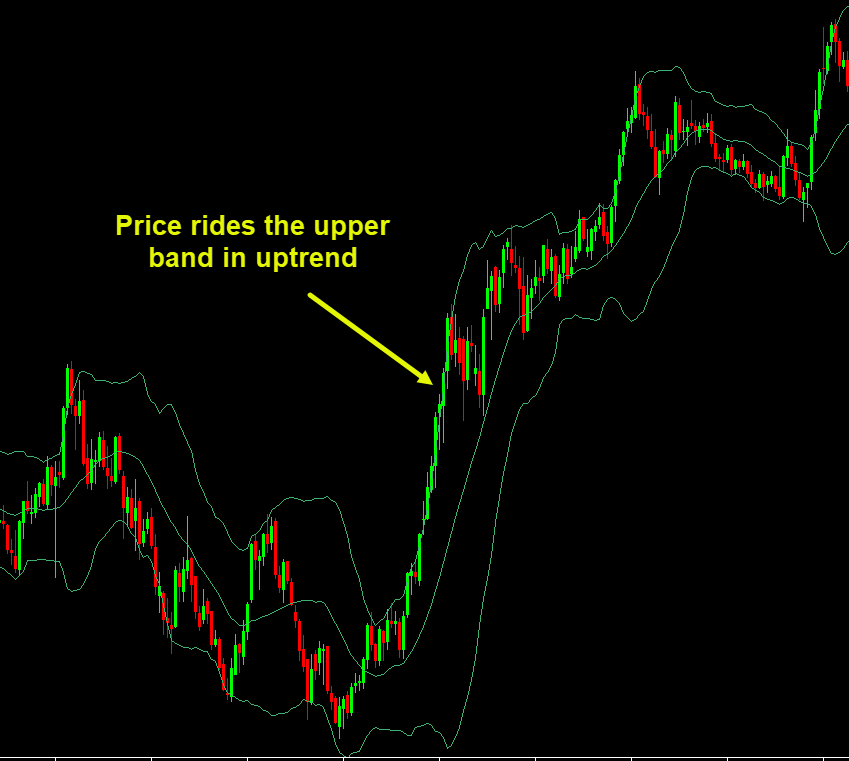
2. Riding the Bands — Trend Strength
In a strong move: ✔️ Price will cling to the upper band in an uptrend
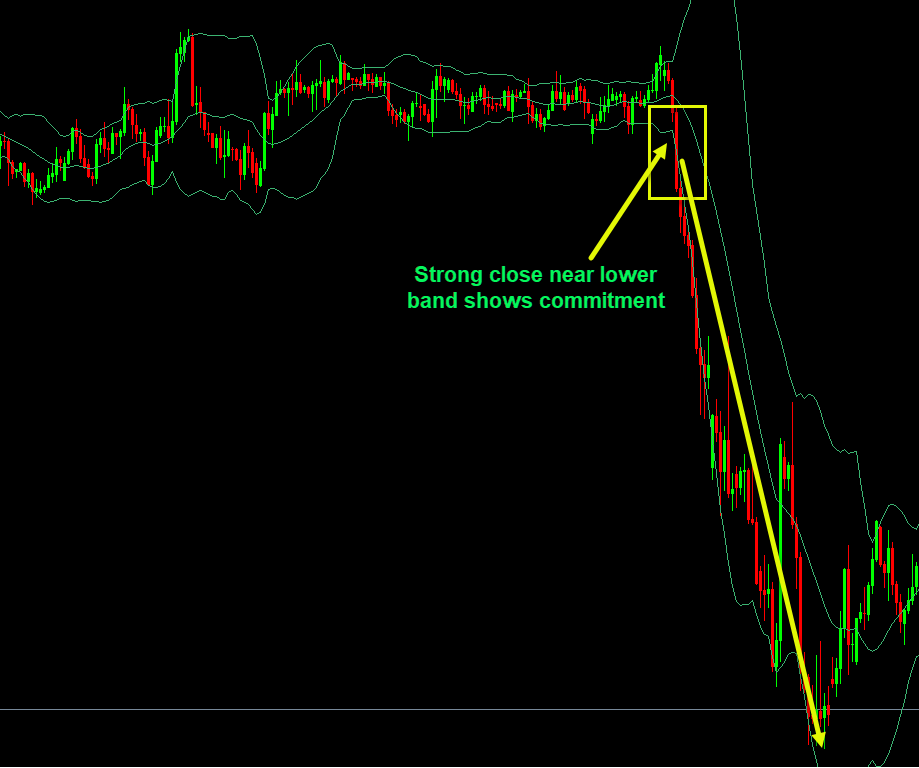
✔️ Price will ride the lower band in a downtrend
This is NOT random. It reflects consistent directional force.
If price keeps hitting the band like a dog chasing a stick, momentum is intact.
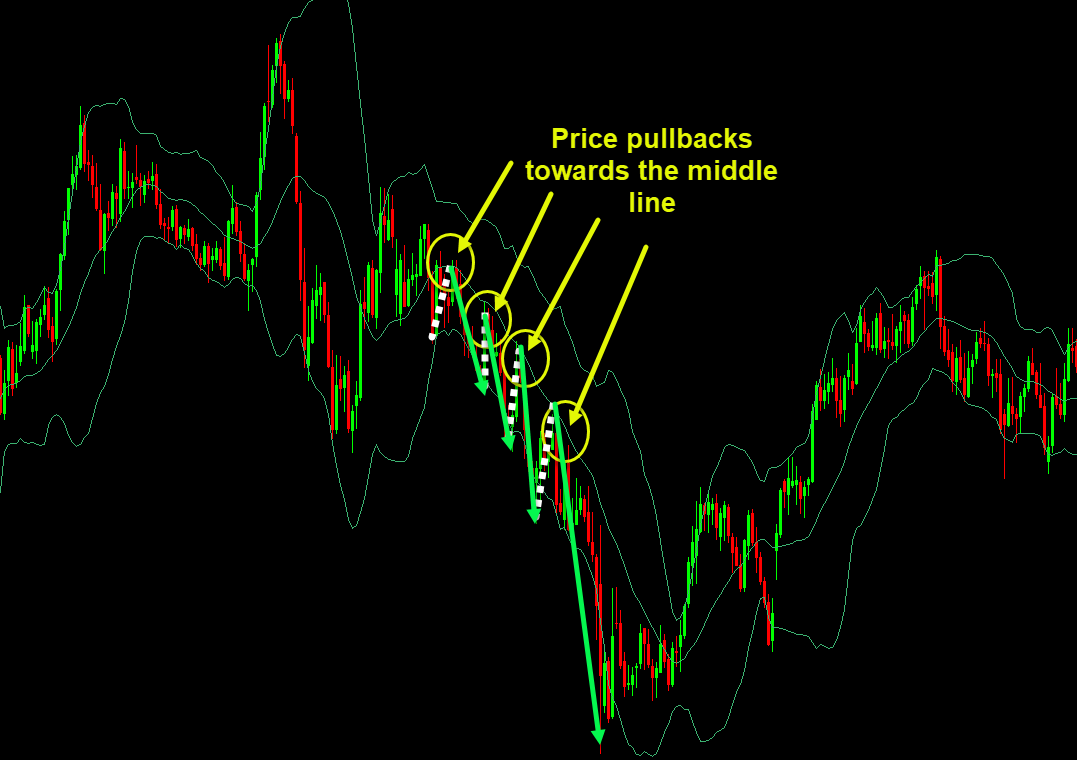
3. Mean Reversion — Price Returns to Average
Markets tend to balance over time. When price gets too far from the middle line:- A pullback toward the middle average is common
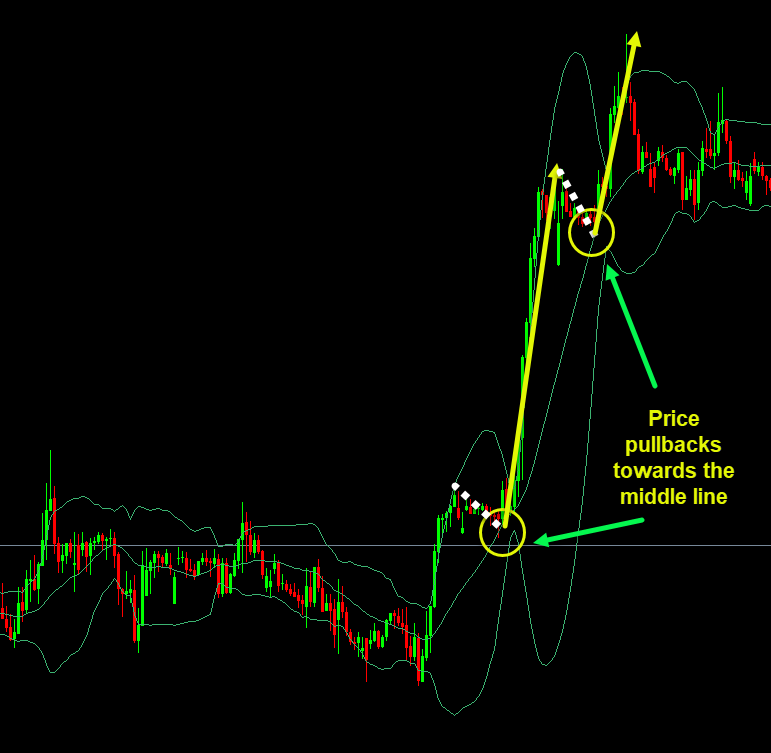
This doesn’t guarantee reversal — but it increases the odds of a pause or correction . Extra Tips
- Strong closes near outer bands show commitment (especially after bands were squeezed)
- Tight bands followed by expansion warn of large moves
How To Use Bollinger Bands — Practical Trading Strategies
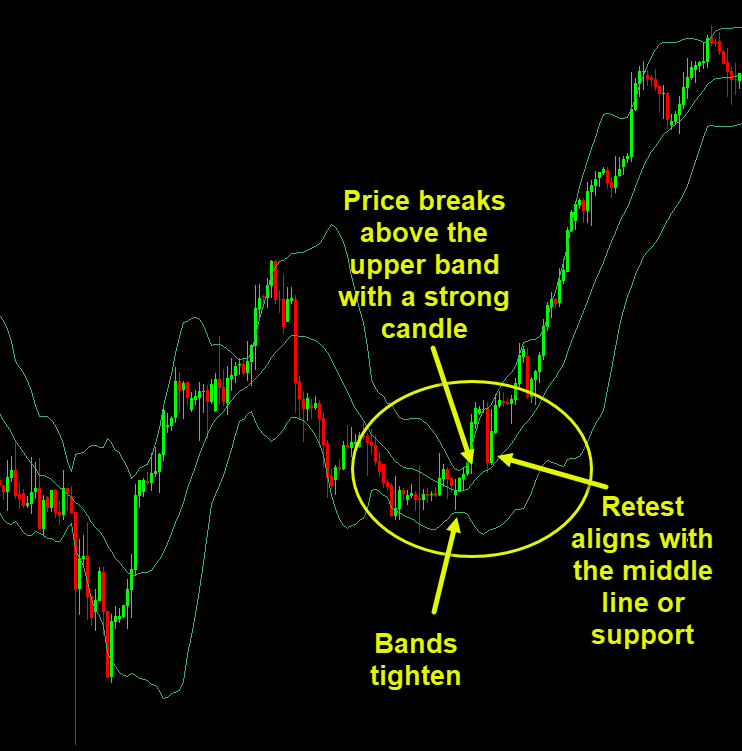
Let’s look at how Bollinger Bands behave in real setups.Strategy 1: The Squeeze Breakout
- Bands tighten significantly
- Price breaks above the upper band with a strong candle
- Retest aligns with the middle line or support
- Entry after confirmation
Strategy 2: Trend Confirmation
If price is climbing the upper band and forming higher highs, the trend is likely strong. Enter after pullback and place the stop loss below the last swing low.
Use this info to:
✔️ add to positions
✔️ avoid countertrend trades
✔️ manage stop placement beneath swing lows
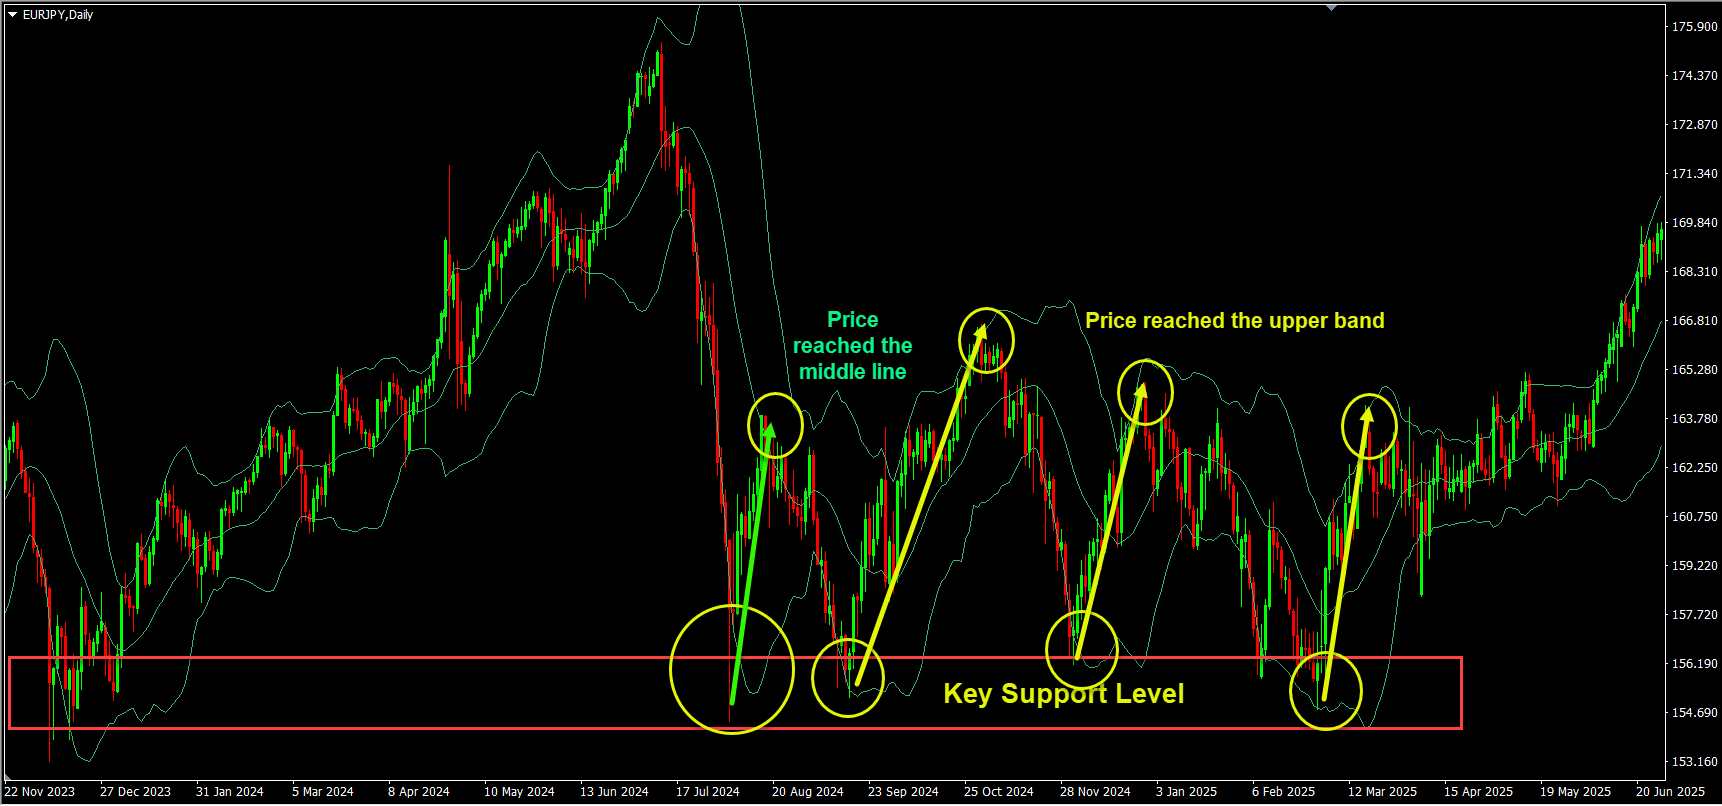
Strategy 3: Pullback Toward the Middle Line or Opposite Band From Key Levels
When price reaches beyond the band, many traders think: “Oh, it’s overbought — time to sell!” Not so fast. Just because price touches the upper or lower band doesn’t automatically mean a reversal. It often means strong momentum. Instead of guessing, ask:
✔️ Is price closing decisively outside the band?
✔️ Are candles showing rejection (long wick)?
✔️ Is there a key level nearby?
In the below example you can see that the price reached a key support level and whenever the price reaches the lower band it moves higher towards the middle line or to the upper band. When Bollinger Bands are combined with key levels we may expect the price to reach the middle line or the opposite band.Common Mistakes Traders Make With Bollinger Bands
Let’s debunk some misconceptions:❌ Mistake 1: Band Touch = Automatic Trade
False. Bands tell you price context, not a buy/sell signal.❌ Mistake 2: Using One Timeframe Only
Signals on a 5-min chart may be noise if the daily trend is against you. Fix: Align with higher timeframes first.❌ Mistake 3: Ignoring Market Structure
Bands work best with price structure — not instead of it. Use support, resistance, and candlestick confirmation.Bollinger Bands — Checklist Before You Trade
✔️ Are the bands tight or wide?
✔️ Is price near a key level or structure?
✔️ Does the trend match the signal?
✔️ Has volatility suddenly changed?
✔️ Are there confirming momentum signals?
If you answered yes to most, setup quality just improved — not guaranteed, but better.