1. Introduction – Why this matters for Forex traders
When you sit down at your chart of, say, the EUR/USD or GBP/USD, you’ll see candles rise and fall. Behind each candle is a story of battle between buyers and sellers. If we can decode that story, we can gain an edge.
Candlestick patterns fall broadly into
two big categories:
- Reversal signals — where the trend you’re in may come to an end and a new one starts.
- Continuation signals — where the current trend is likely to keep going.
In Forex trading, recognizing whether a setup is hinting at
“trend turns” or
“trend rides on” is a key skill. In this article, I’ll explain, in simple language:
- What reversal vs continuation candlestick signals are
- How to spot them in Forex charts
- How to trade them with context
- Common mistakes to avoid
Let’s get started.
2. The Basics: What are reversal and continuation candlestick signals?
2.1 What a candlestick shows
A candlestick is simply a visual representation of the open, high, low and close of a time period (say 1 hour, 4 hours, daily) for a currency pair.
- If the close is above the open -> generally a bullish candle.
- If the close is below the open -> generally a bearish candle.Understanding that gives you a good, solid base.
2.2 Reversal signal – definition
A reversal candlestick signal suggests that the existing trend may be ending, or at least pausing and turning.
For example, if the price has been going down (downtrend) and you see a strong reversal candle pattern, it may mean the downtrend is losing steam and a new up-move may begin.
2.3 Continuation signal – definition
A continuation candlestick signal indicates that the current trend (up or down) is likely to keep moving in the same direction. That is, instead of a turn, the trend is riding on.
For example, in a strong uptrend, you may spot a pattern that simply pauses briefly then continues upward.
2.4 Why the distinction matters in Forex
Because Forex is about capitalizing on movements — either exits/trend-changes or riding trends — knowing whether a candle signals a turn or a continuation helps you decide:
- Do I join the trend or get ready for a turn?
- Where do I put my stop-loss?
- What risk/reward may apply?
In other words, trading the wrong kind of signal (thinking it’s a reversal when it’s a continuation, or vice versa) often leads to friction, whipsaws or stops.
3. Key reversal candlestick signals to watch in Forex
Here are some of the more reliable reversal-type candlestick signals, and how you can spot them in currency-pair charts.
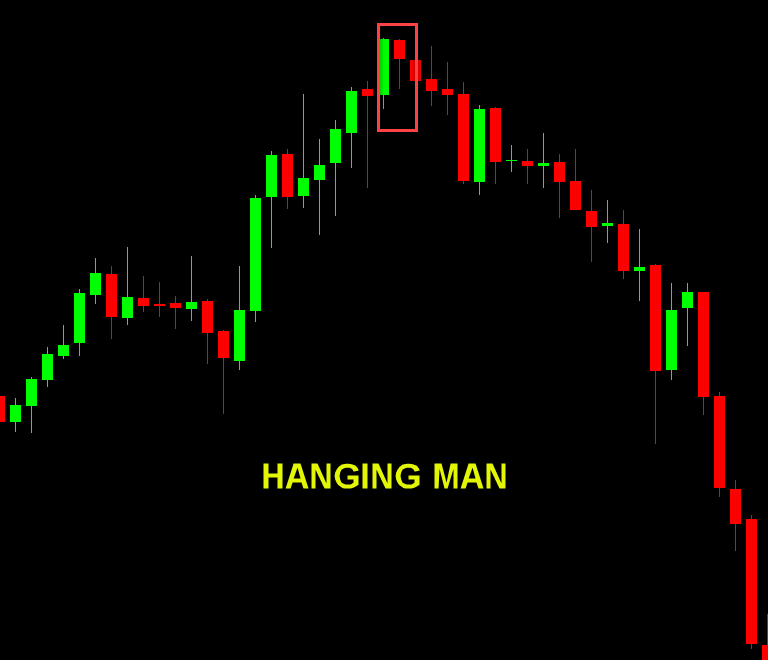
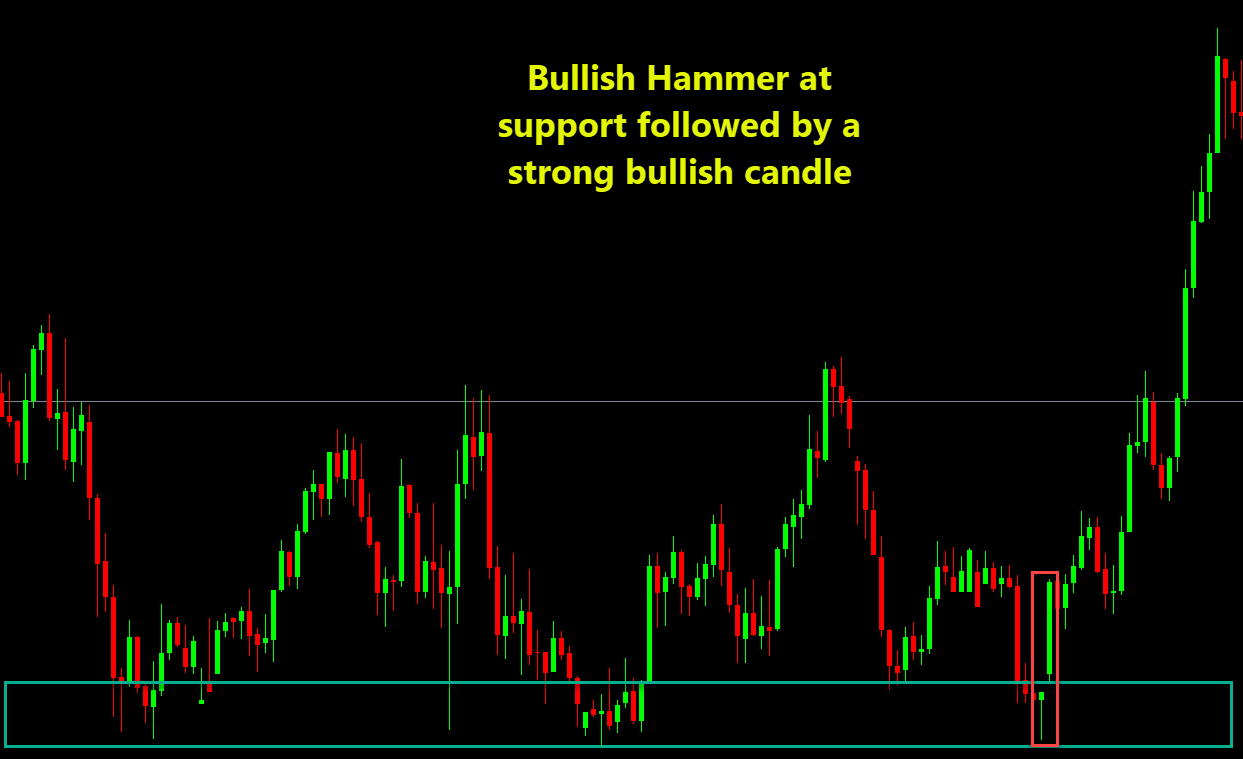
3.1 Hammer / Hanging Man
- Hammer: Appears after a down-move. Small body near top, long lower wick. Buyer pushes from low.
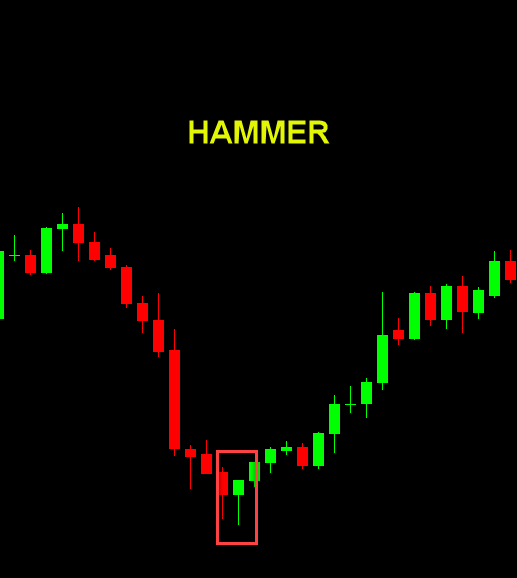
- Hanging Man: Appears after an up-move. Same shape, but here it signals possible exhaustion of the uptrend. Looks like a hammer, but red, and at the end of an uptrend.
How to read it: If you see a hammer after a decent down-trend in, say, GBP/USD, it suggests sellers were in control, but buyers stepped in hard — first hint of a possible change.
Tip: Wait for the next candle to close above the hammer’s high/low for confirmation.
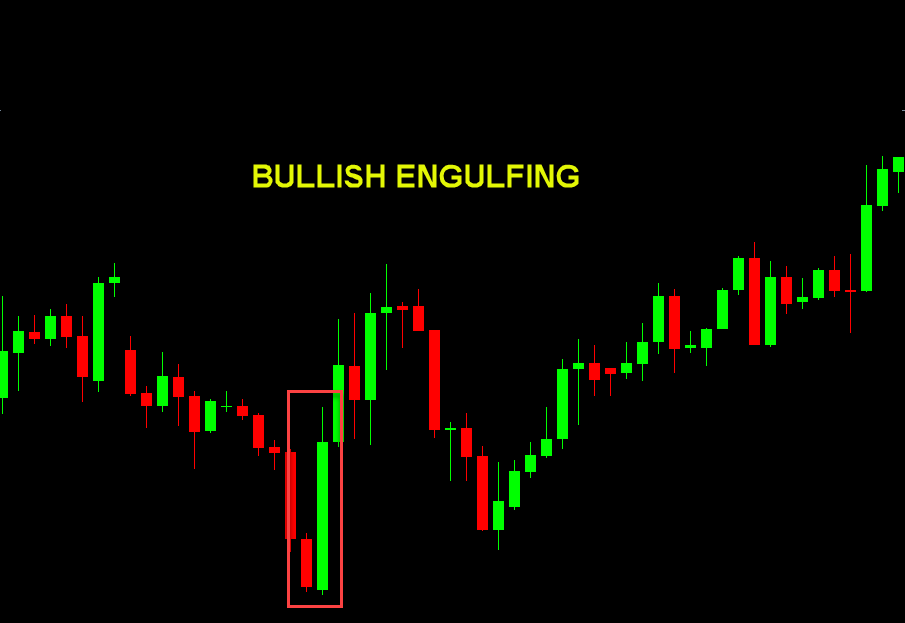
3.2 Engulfing patterns (Bullish and Bearish)
- Bullish Engulfing: A bullish engulfing pattern shows up in a downtrend when a small red candle is followed by a larger green candle that completely covers the prior body. It signals that buyers have stepped in with strength and may be taking control. Many times, the engulfing will cover more than just one of the previous candles.
- Bearish Engulfing: During an uptrend, a small bullish candle then a large bearish one engulfing it – shift to sellers.
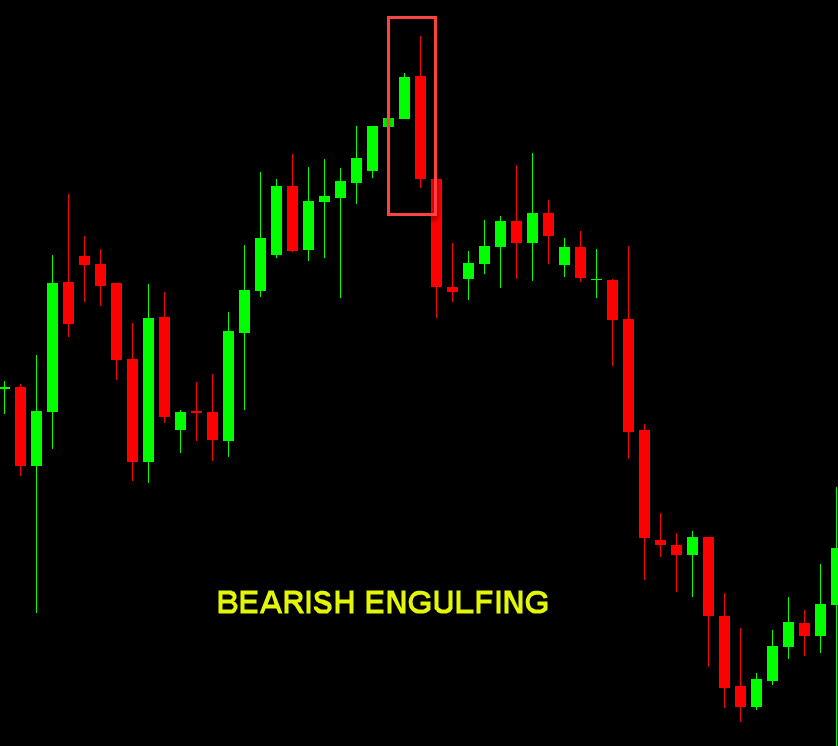
How to apply in Forex: Use at key levels (support/resistance) for best probability. If EUR/JPY has been rising and you see a large bearish engulfing near resistance, be alert to a potential reversal.
3.3 Morning Star / Evening Star
- Morning Star: Occurs at the end of a downtrend. Long bear candle → small candle / doji (indecision) → long bullish candle
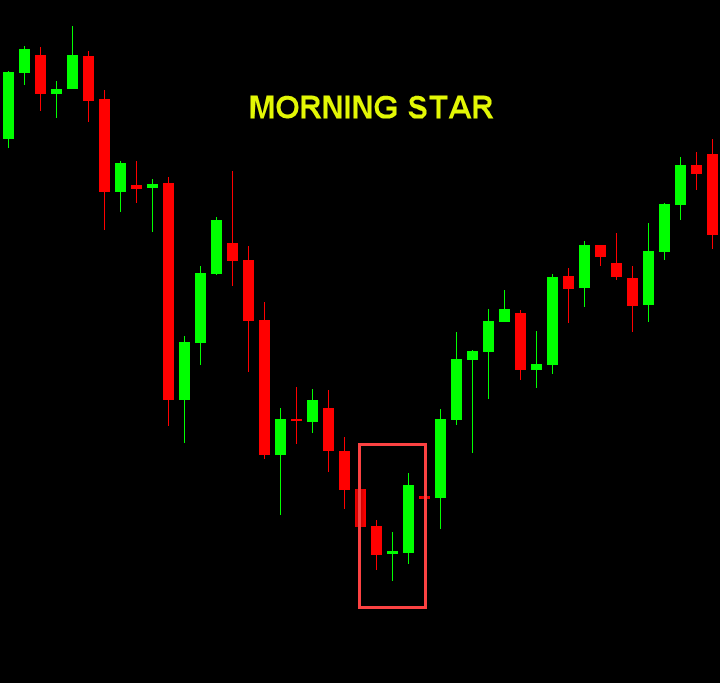 .
.
- Evening Star: The opposite for an uptrend reversal.
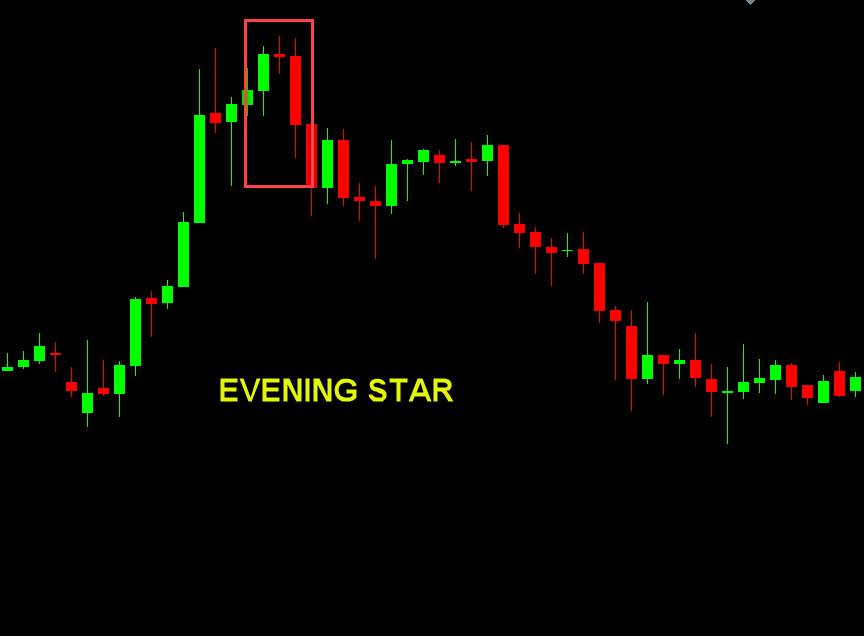
Forex tip: These patterns can be weak if not at a significant level or without confirmation (volume, break of structure). Always check context and look to combine with other technical analysis methods.
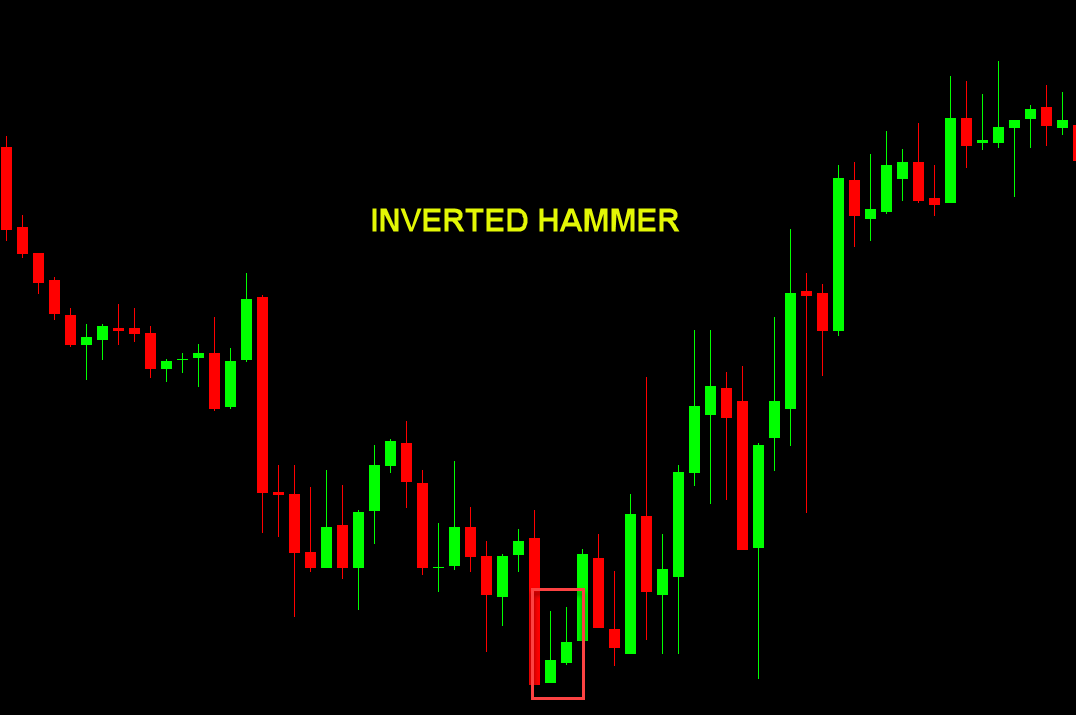
3.4 Pin bar / Shooting Star / Inverted Hammer
- Pin Bar: Long wick, small body — shows rejection of price.
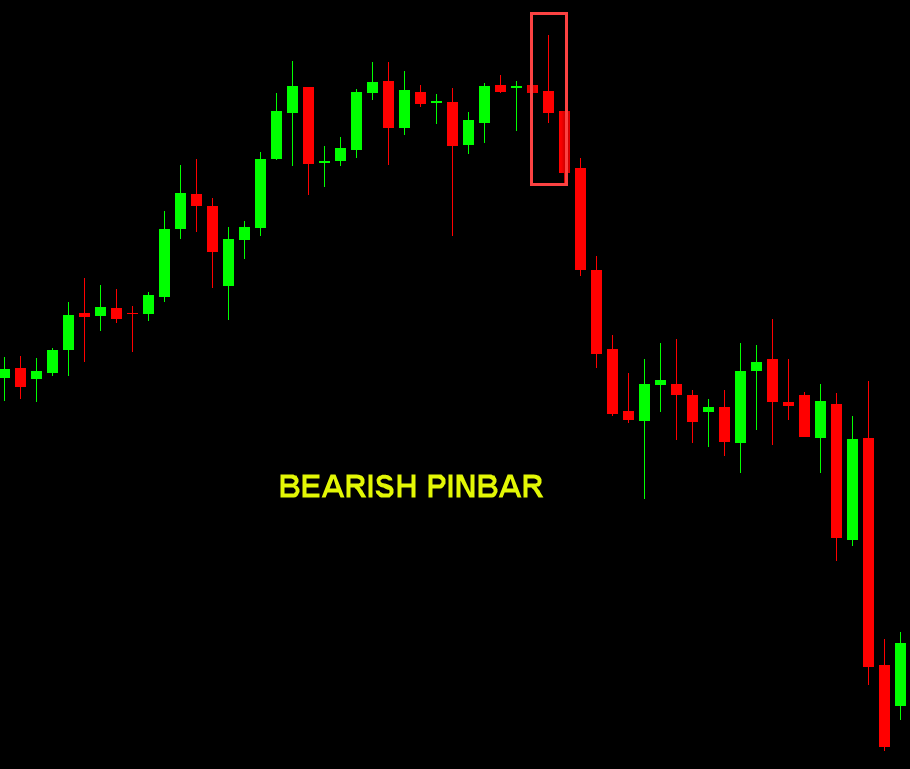
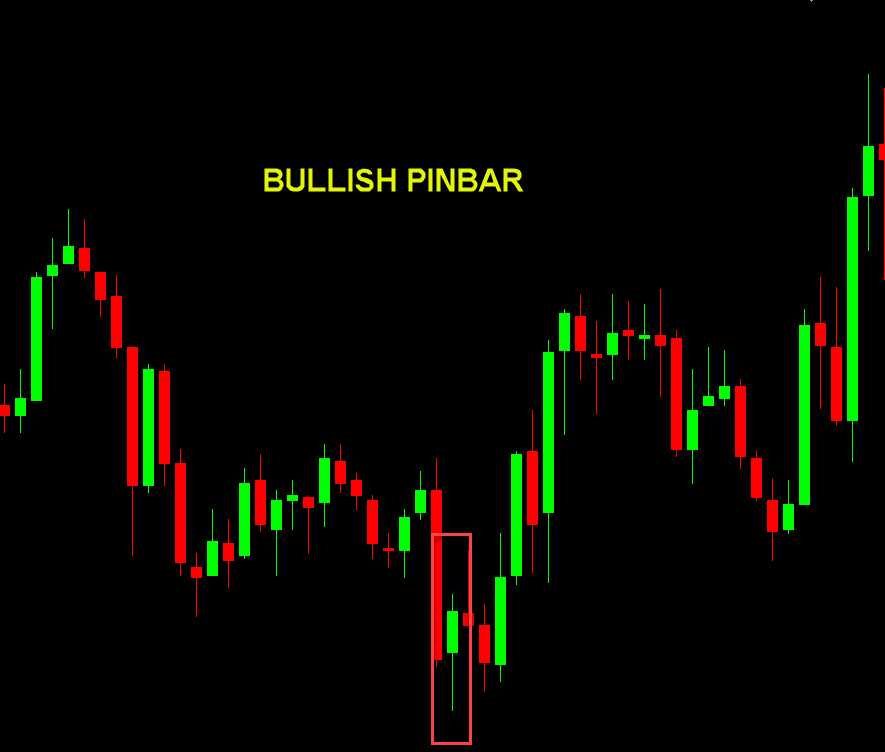
- Shooting Star: After an uptrend — long upper wick, small body at top.
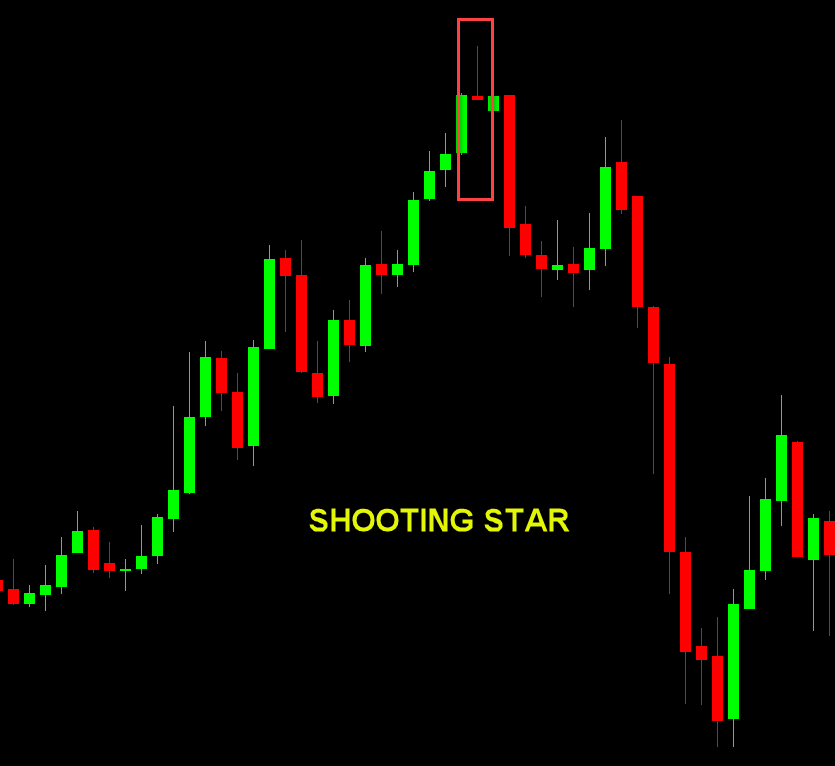
- Inverted Hammer: After downtrend – long upper wick, small body at bottom.
In Forex: On the 4-hour or daily chart, a pin bar at a major S/R zone is one of the stronger setups that traders love to follow.
3.5 Things to check for stronger reversal signals
- Confirm the prior trend is established (e.g., at least a few candles in that direction)
- Signal appears at a key level (support/resistance, trendline)
- Volume (or session size for Forex) suggests a strong push by one side
- Confirmation: the next candle moves in the intended direction
4. Key continuation candlestick signals for Forex
Once you’ve found a trend, you want to ride it. As the old saying goes, the trend is your friend! Continuation signals help you join and stay with the trend. Here are important ones.
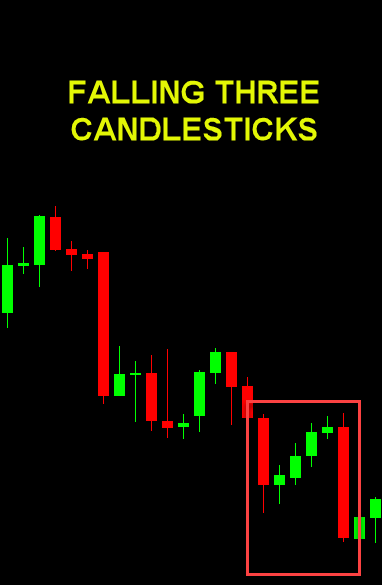
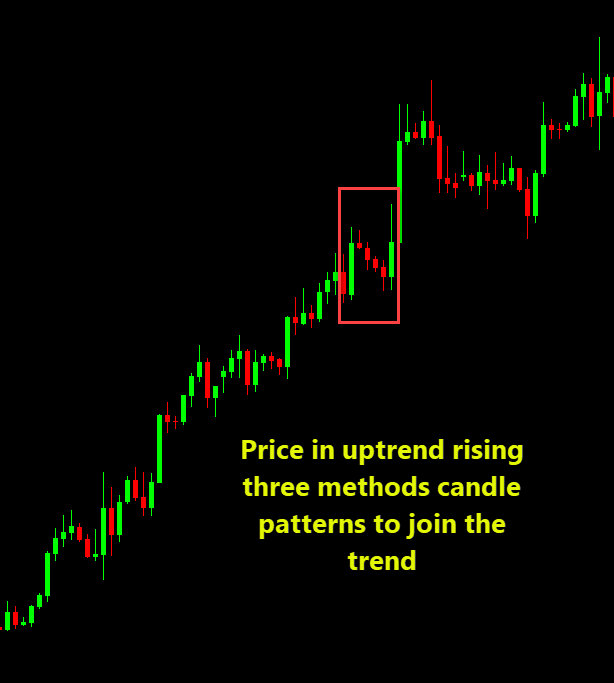
4.1 Rising Three Methods / Falling Three Methods
- Rising Three Methods: In an uptrend: Long bullish candle, followed by 3 (or more) smaller bearish but contained candles, then another long bullish candle. Indicates buyers are in control.
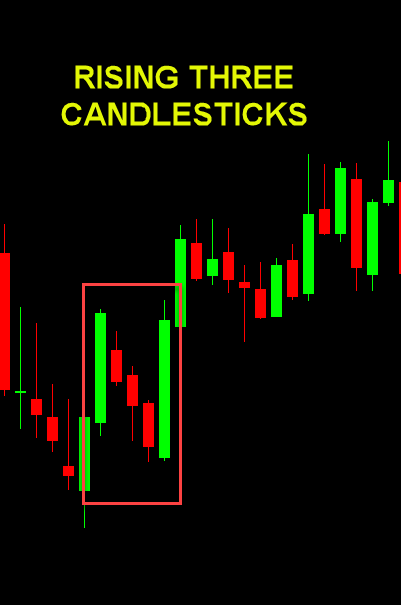
- Falling Three Methods: Opposite in a down-trend.
Forex application: If USD/JPY is trending up and you spot a “rising three methods” on H4 or daily, that gives you confidence the trend is intact, and you might add to longs or hold existing ones.
4.2 Doji in a trend
- Dojis often signal indecision. Within a strong trend, that indecision can often act as a pause rather than a turn — hence a continuation signal.
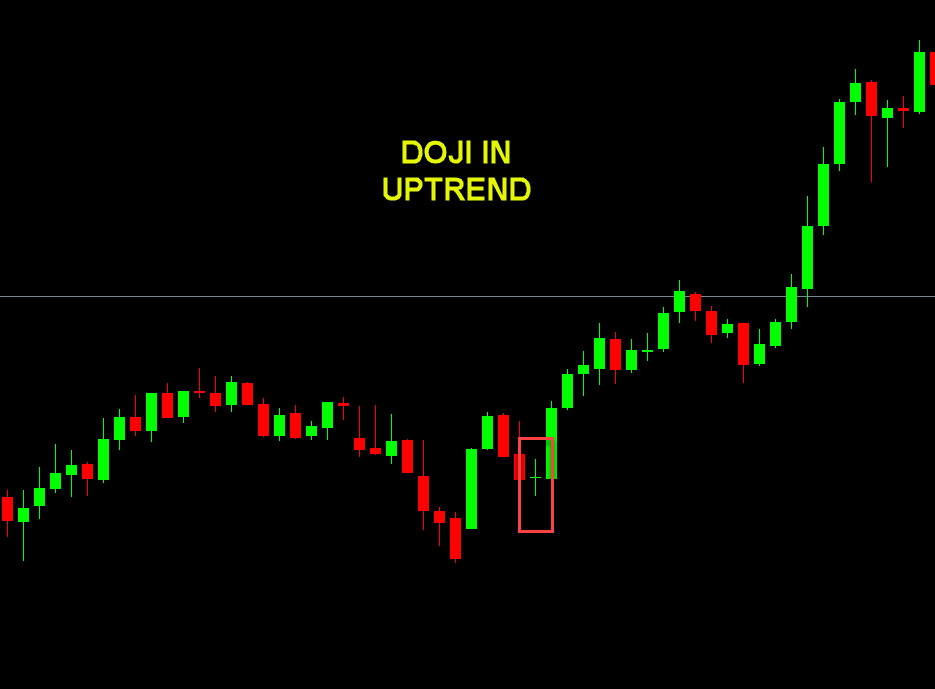
- Example: In an up-trend, you might see a doji, then the price resumes upward — the doji was just a breather.
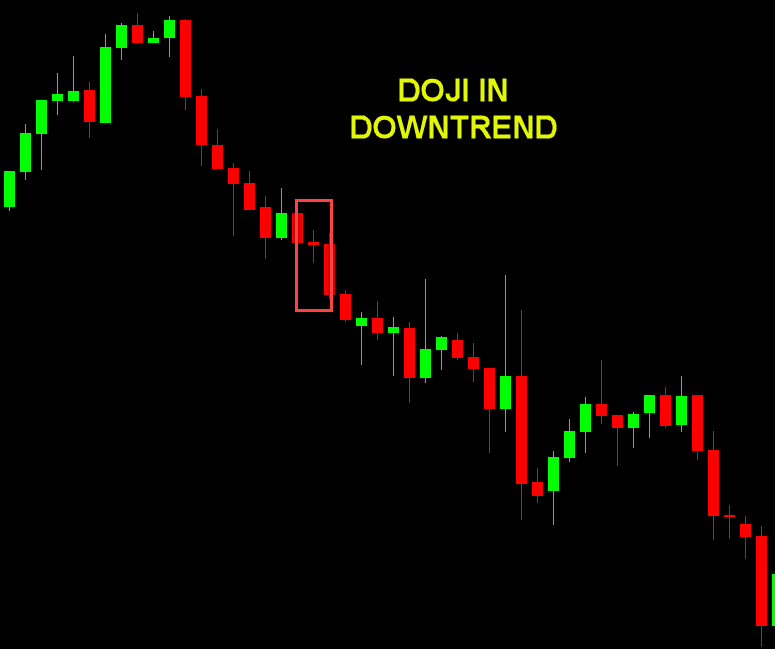
Tip: Use caution — dojis are neutral by themselves. In trend context, they lean continuation, but at key levels, they may flip to reversal.
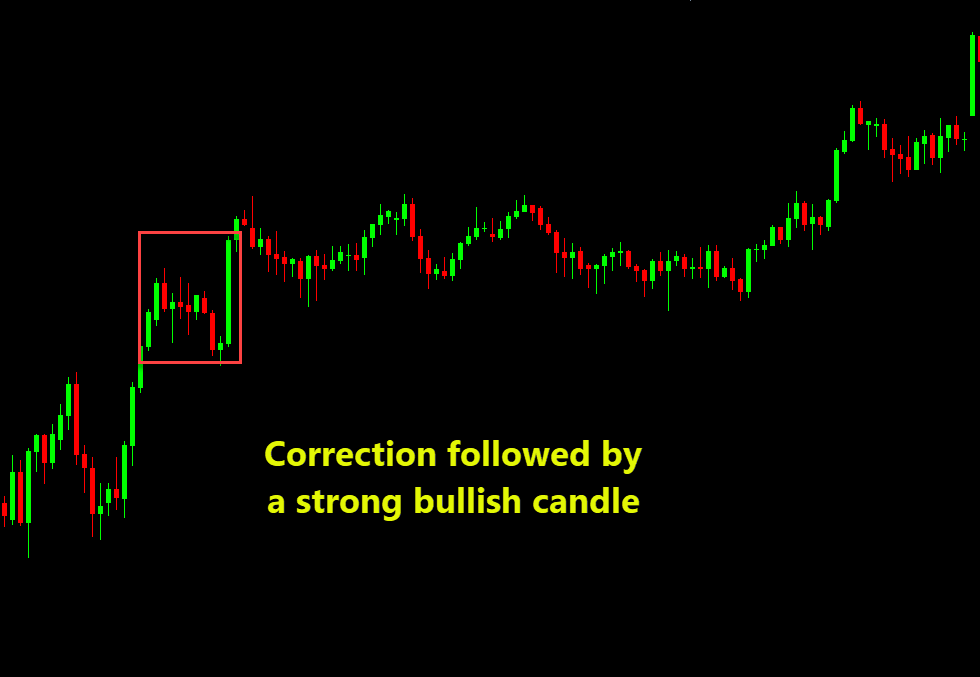
4.3 Simple long candle after consolidation
Sometimes the simplest signal: in trend, price pulls back or consolidates, then a strong candle in the trend direction appears — that is a continuation cue. The candlestick isn’t named “pattern” but the logic is the same.
4.4 What strengthens continuation signals
- Trend structure is intact (higher highs/higher lows in up-trend; lower lows/lower highs in down-trend)
- The signal candle breaks or closes beyond the consolidation
- Minimal overlap with previous candles in the opposite direction
- Macro drivers or momentum confirm trend strength
5. How to trade reversal vs continuation signals — practical steps
5.1 Step-by-step entry process
- Identify the context
- Is the market trending or in a range?
- What timeframe are you trading? (H1, H4, Daily…)>
- Where are your support/resistance levels and trendlines?
- Spot the candlestick signal
- Is it a reversal pattern or a continuation pattern?
- Does it sit at a meaningful level?
- Wait for confirmation
- For reversal: look for a follow-up candle in the new direction, ideally breaking structure.
- For continuation, look for a candle that breaks out of a pullback/consolidation.
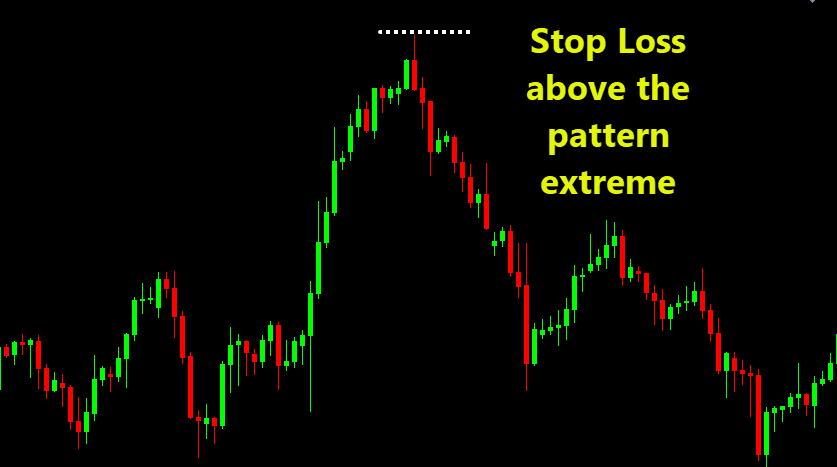
- Risk management
- Place stop loss logically: for reversals, ideally below/above the pattern extreme; for continuation, ideally below the consolidation.
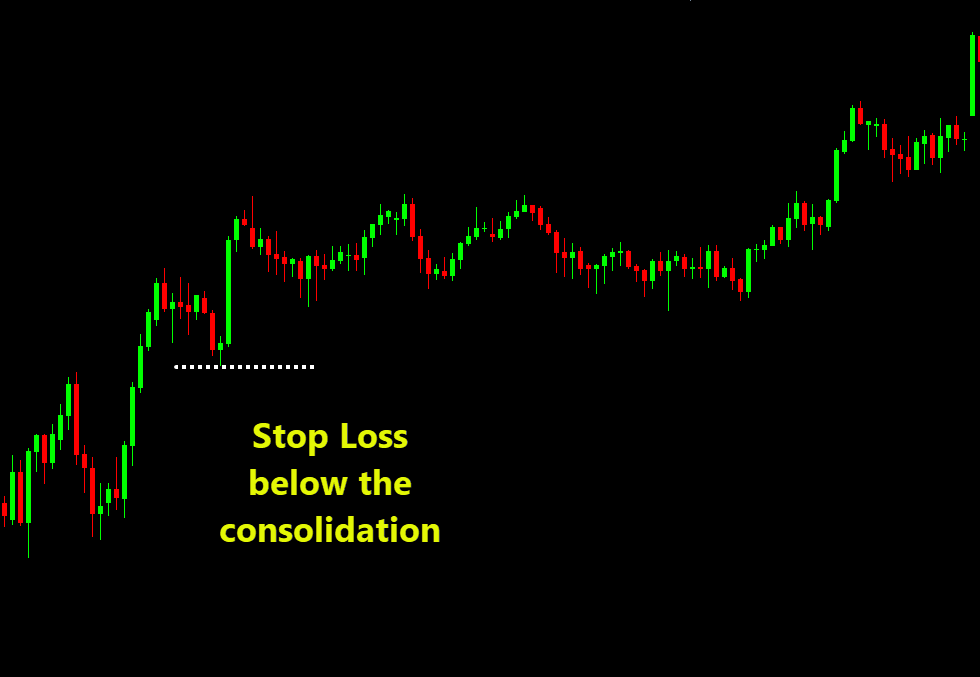
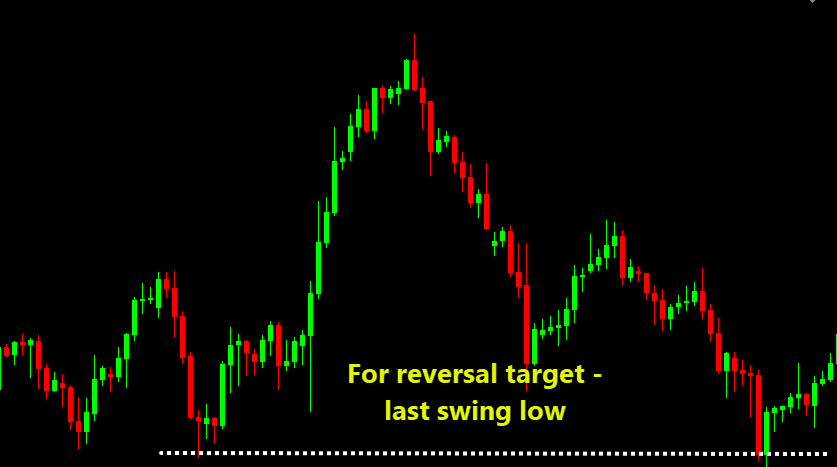
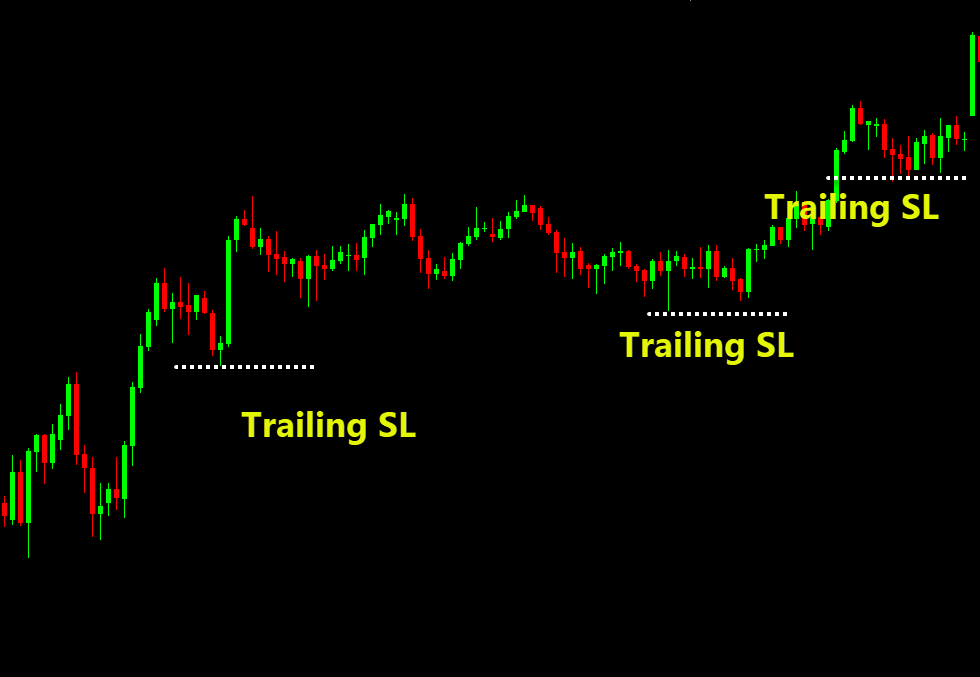
- Define target: for reversals, longer objectives; for continuation, ride the trend or use trailing stops.
- Manage trade
- Monitor price action after entry.
- If the pattern fails (price reverses against you), re-evaluate quickly.
5.2 Examples for Forex
- Reversal trade: GBP/USD you spot a hammer at a strong support level, the next candle closes bullish, you go long.
- Continuation trade: EUR/USD in uptrend. You see a “rising three methods” pattern on H4, you join long in the trend.
5.3 Pitfalls and what to avoid
- Taking reversal patterns in a thin context (no prior trend) — signals weak.
- Assuming continuation forever — trends can end suddenly.
- Ignoring higher timeframe structure. A reversal on H1 might be just a pullback on Daily.
- Not using confirmation — jumping in too early.
- Forgetting risk: pattern recognition does not guarantee an outcome.
6. Compare & contrast: Reversal vs Continuation signals
| Signal Type |
Trend Direction |
Typical Location |
Trader’s Goal |
| Reversal |
Change of direction (up→down or down→up) |
At trend end, near key level |
Enter new trend or exit existing position |
| Continuation |
Same direction as current trend |
Within trend, after consolidation/pull-back |
Add/ride the trend, manage position |
What to look for:
- For a reversal: trend must exist, pattern must show exhaustion + reaction, confirmation is vital.
- For continuation: trend must exist, pattern shows momentum + lack of reversal, join rather than fight.
7. Summary – Key takeaways
- Candlesticks tell stories of buyer/seller dynamics.
- Reversal signals hint that the current trend may end or turn.
- Continuation signals tell you the trend likely persists.
- Always place the pattern within context (trend, level, timeframe).
- Confirm the signal with price action, breakouts or follow-through.
- Apply good risk and trade management — no pattern is perfect.
- In Forex, trends can be strong and long-lasting, making continuation signals especially useful — but also quick to reverse, making early reversal recognition a powerful tool.
8. Final thoughts
In the world of Forex, clarity comes when you recognize what the market is trying to do. Is it saying, “I’m done and about to turn,” or is it saying, “I’ll keep moving”? Candlestick patterns give you a
cue — a glimpse into market psychology — but like all cues, they must be backed by context, logic and discipline.
Keep practising these signals on your charts (demo or live) — mark how they appear on H4, Daily, weekly. Identify zones, see how the price reacts. With time, you’ll develop a “feel” for whether a candle is a hint of the end or a green light to continue.
Here’s to spotting the right signals — and riding the right moves.
Trade well. Trade smart.