If you’ve spent any time watching Forex charts, you’ve likely seen price-making patterns that feel familiar — like it’s breathing or pulsing. That “pulse” you’re noticing is the rhythm of higher highs and lower lows , and it’s one of the most fundamental and powerful concepts in price action trading.
In this article, we’ll uncover:
✔ What higher highs and lower lows actually mean ✔ Why they matter in Forex trading ✔ How they help you read trends like a professional ✔ Practical examples you can spot on your own charts ✔ Common pitfalls and how to avoid them
1. What Are Higher Highs and Lower Lows? Simple Definitions
Imagine price on a chart like a mountain range:
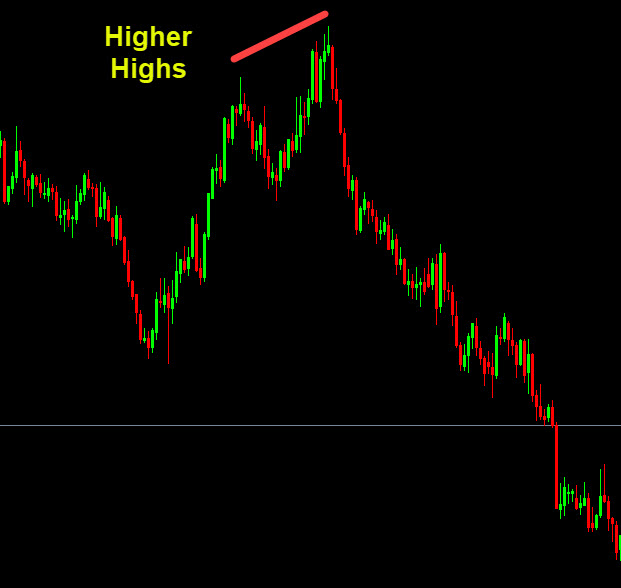
- Higher Highs (HH) – Price pushes upward and reaches a new top that exceeds the last swing high.
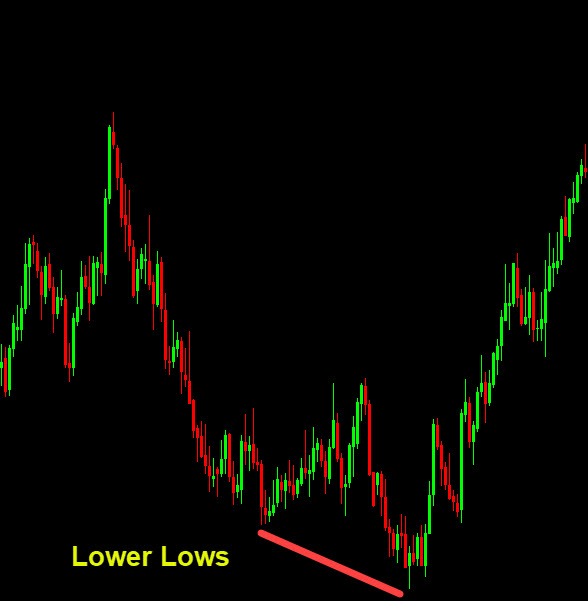
- Lower Lows (LL) – Price drops further and forms a new bottom below the previous swing low.
Think of them as markers showing whether buyers or sellers are in control:
📈 Higher Highs → Buyers are strong
📉 Lower Lows → Sellers are strong
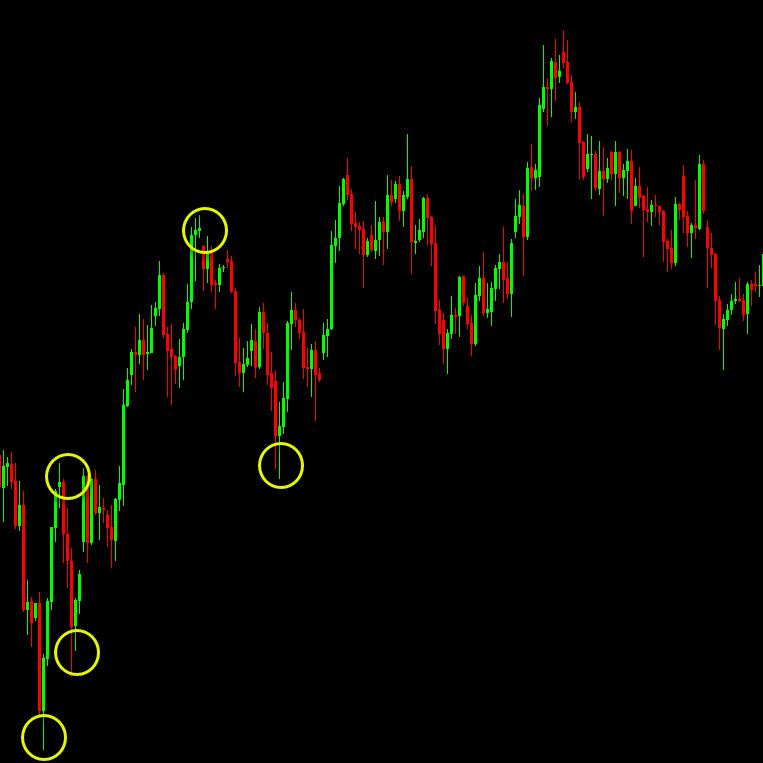
Here’s how they look on a real chart:
2. Why These Patterns Matter in Forex
Unlike fancy indicators that lag behind price, higher highs and lower lows are pure price action — they come straight from the market’s heartbeat.
Here’s what they tell you:
✔ Market Direction
- Uptrend = sequence of higher highs and higher lows
An uptrend shows consistent bullish pressure, with price moving higher as buyers dominate the market.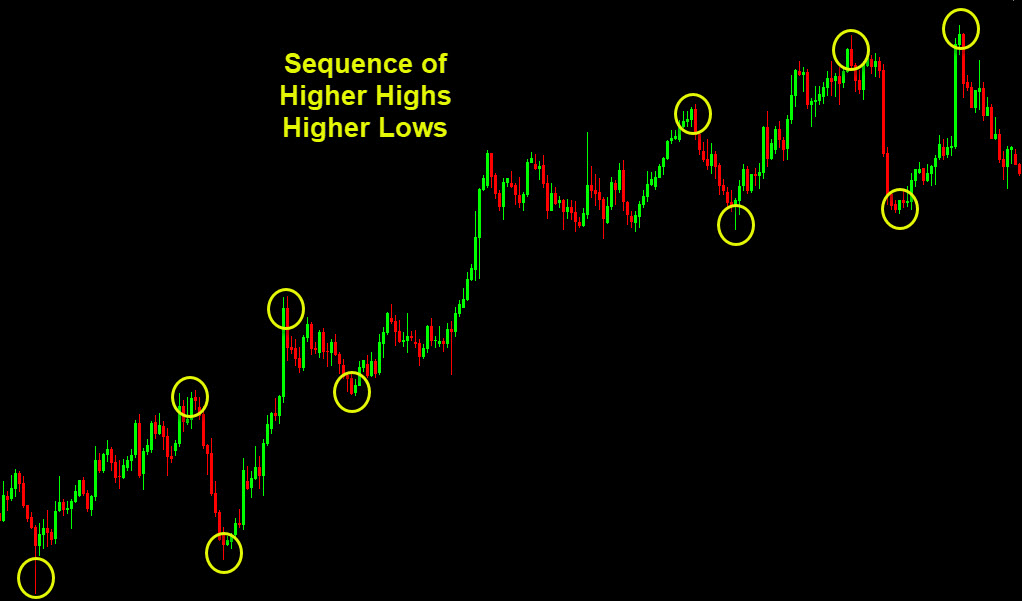
- Downtrend = sequence of lower lows and lower highs
A downtrend shows consistent bearish pressure, with the price moving lower as sellers dominate the market.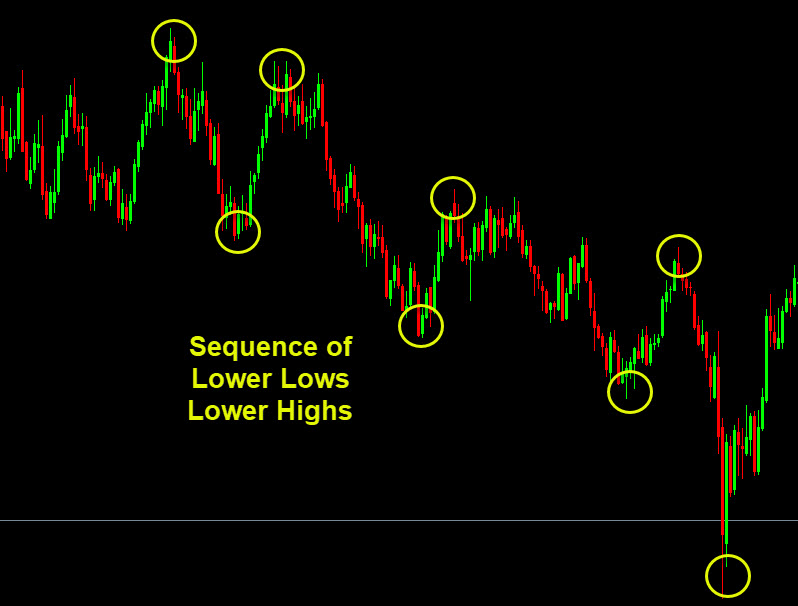
- No clear trend / range = Sideways action without clear higher highs or lower lows
That’s the structural definition of a trend — and it’s much more reliable than guessing.
✔ Shift in Control
When price stops making higher highs and instead starts forming lower lows, market sentiment has changed — buyers may be losing strength and sellers gaining influence.
3. How to Spot Trends Like a Pro
Let’s walk through how higher highs and lower lows reveal real trends.
📌 Uptrend Example
In an uptrend:
- Each new peak is above the last
- Each pullback doesn’t fall as low as the prior one
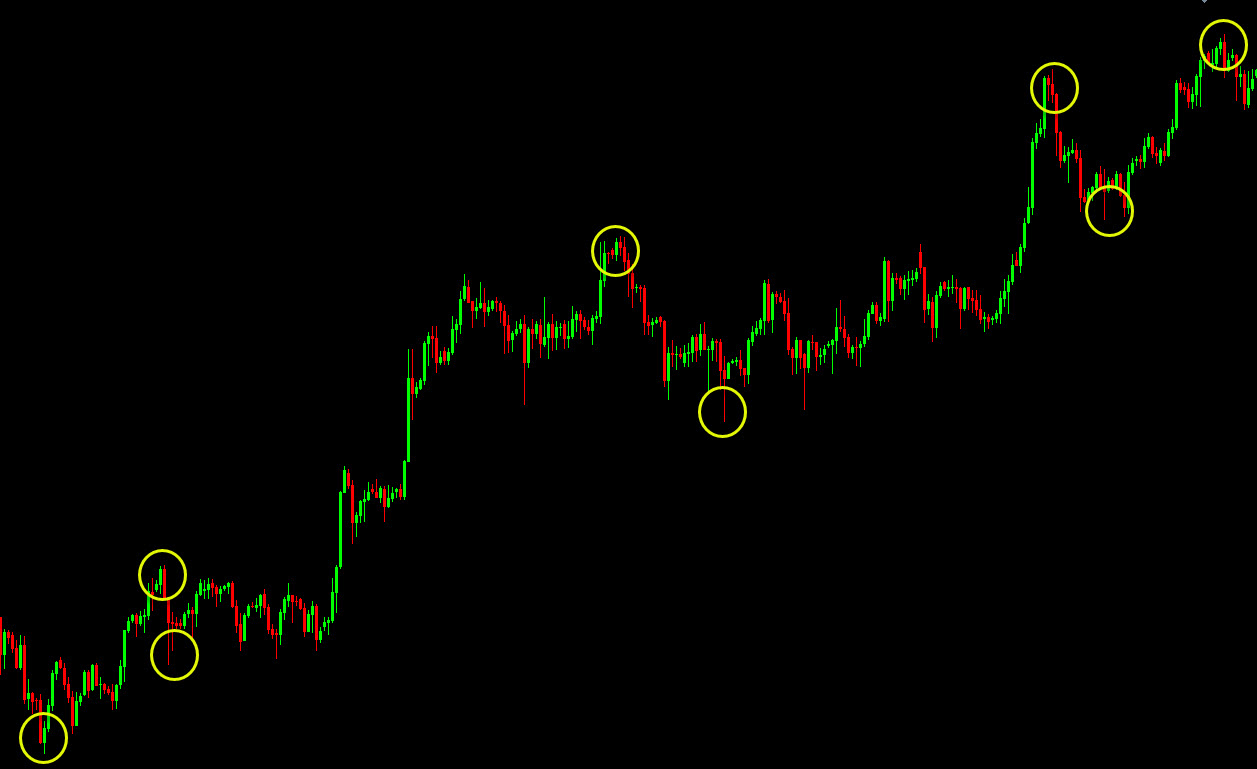
This signals buyers consistently stepping in at higher levels — bullish momentum.
Key takeaway: Every new high and higher low reinforces bullish strength.
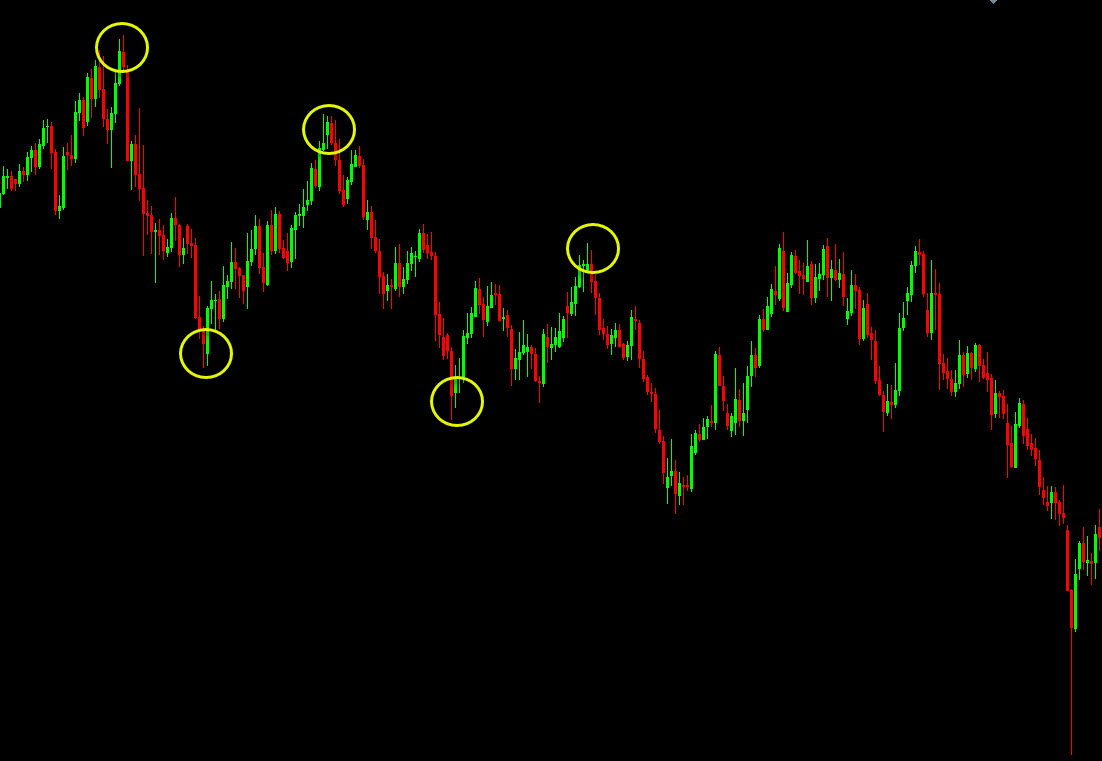
📌 Downtrend Example
In a downtrend:
- Each valley (low) is lower than the last
- Each rally fails to reach the previous high
This shows selling pressure dominating.
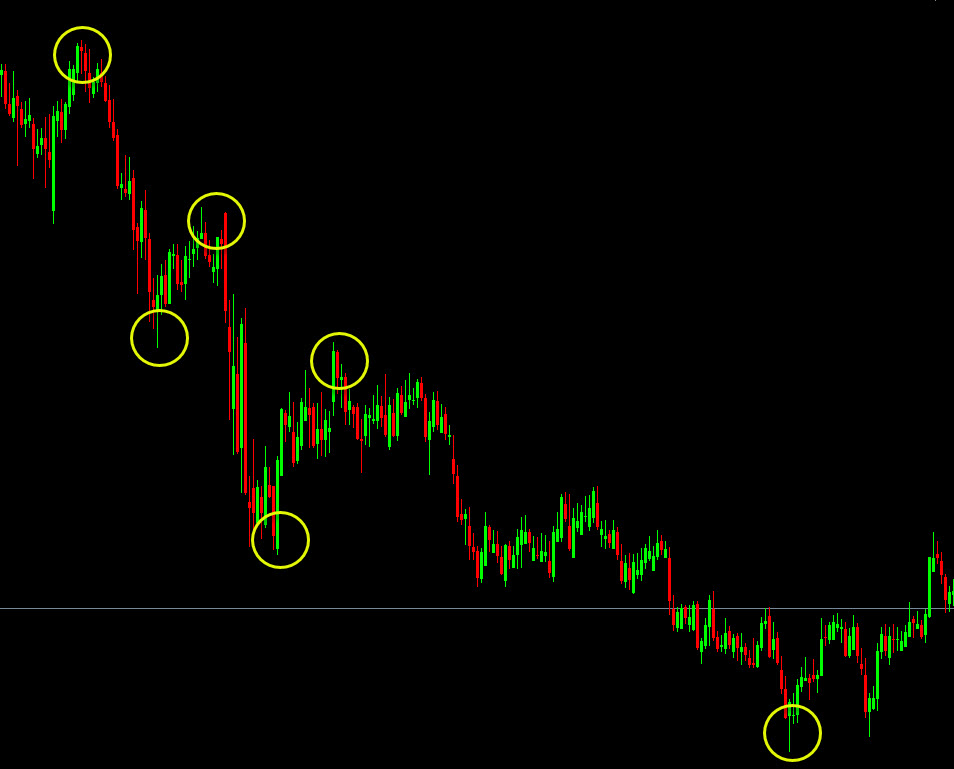
Key takeaway: Lower lows + lower highs confirm bearish dominance.
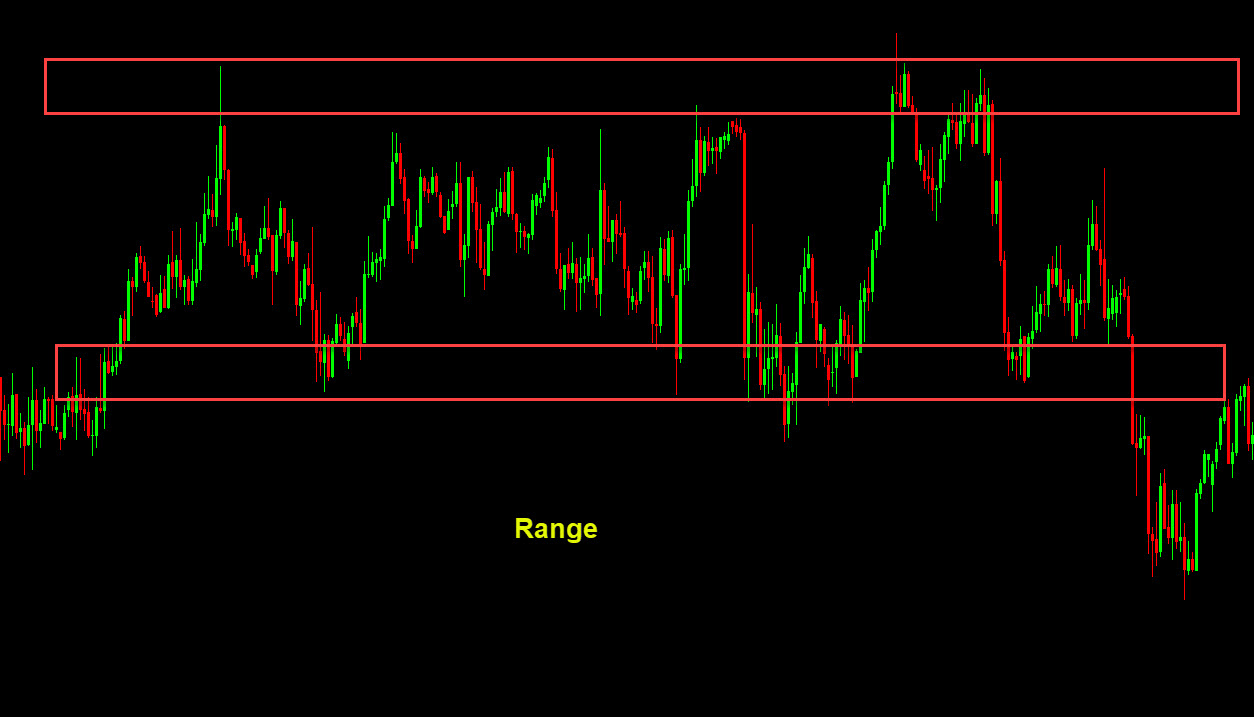
4. Trend vs. Range: What’s the Difference?
Not all markets trend. Sometimes price moves sideways — making swings, but not consistently higher highs or lower lows.
In a range:
- Price makes equal highs and equal lows
- Buyers and sellers are in balance
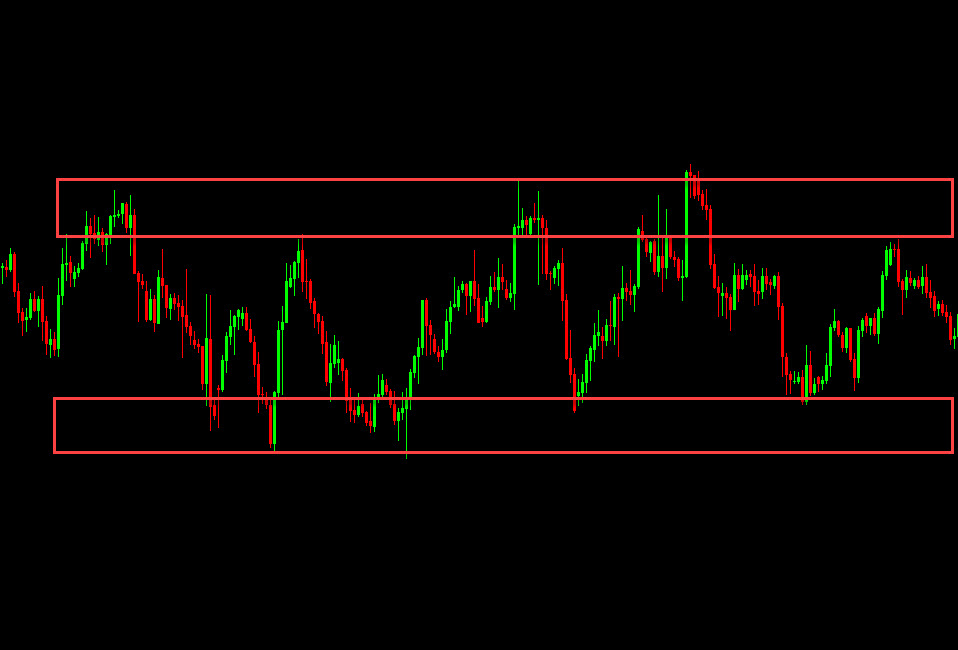
Range-bound markets need different strategies than trending ones — which we’ll touch on later.
5. Why Higher Highs & Lower Lows Work in Forex
Forex is a liquid 24/5 marketplace , driven by:
- Central bank policy
- Economic data
- Interest rate differentials
- Trader psychology
These forces create cycles of buying and selling pressure , and higher highs/lower lows are the clearest footprints of these cycles in action.
In short, price reveals sentiment before indicators confirm it (usually).
6. How Traders Use These Patterns in Real Setups
✔ Trend Confirmation
Before you take a trend trade:
- Look for 2 or more consecutive higher highs and higher lows (for an uptrend)
- Or lower lows and lower highs (for downtrend)
This increases confidence that you’re trading with the prevailing trend.
✔ Entry on Pullbacks
Most trend-following traders don’t enter at the extreme top or bottom… they wait for pullbacks :
- In an uptrend → pullback to the zone around the previous higher low
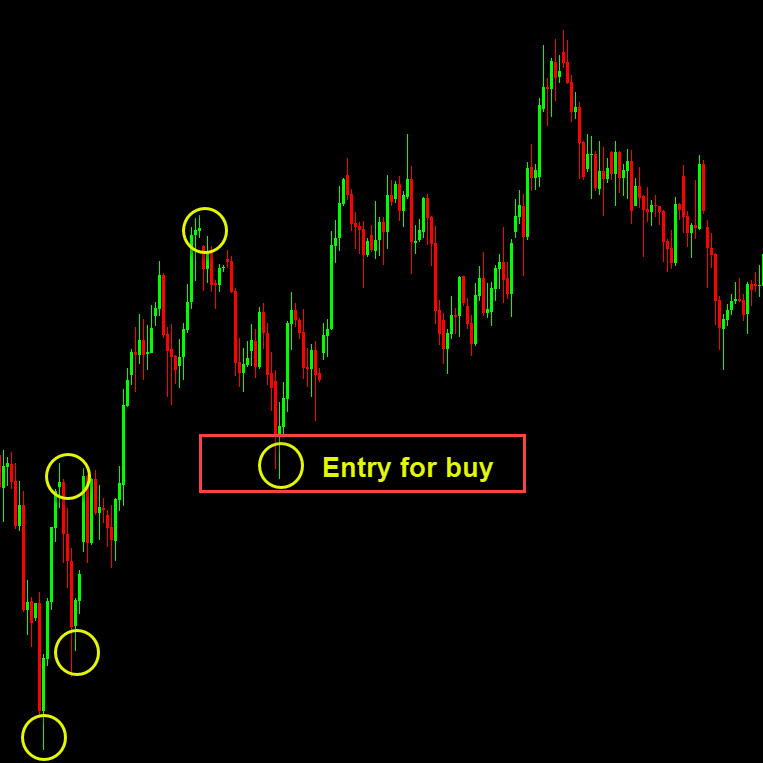
- In a downtrend → pullback to the zone around the previous lower high
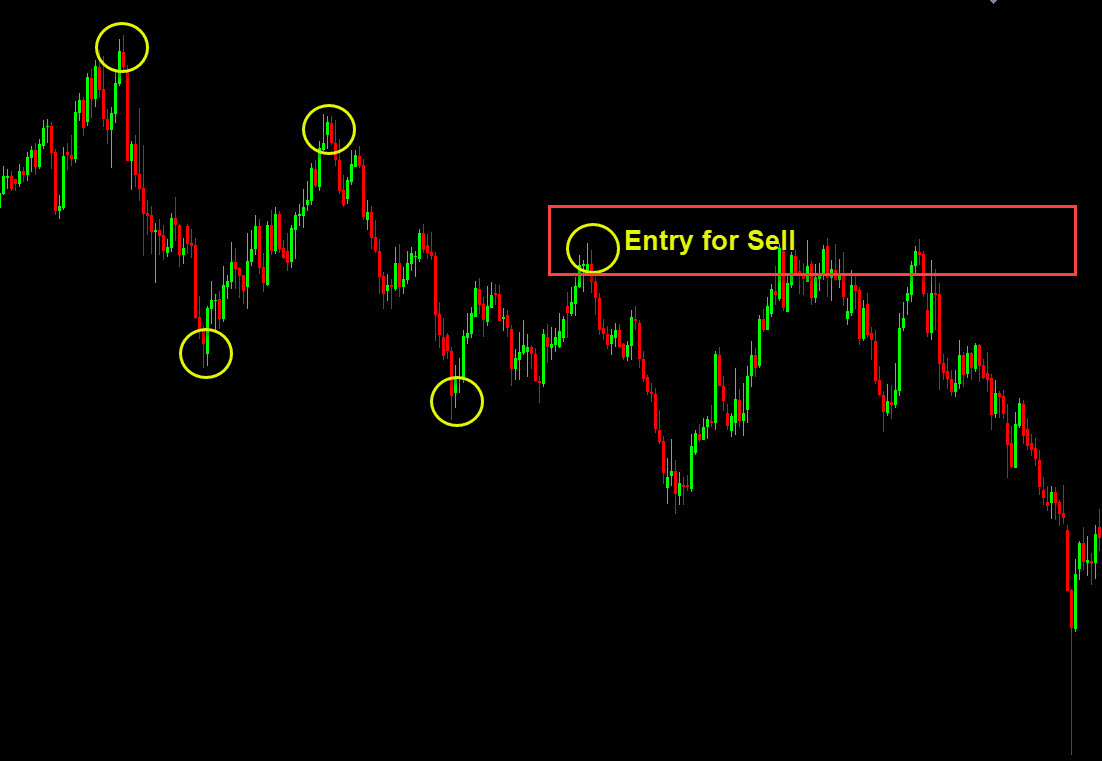
This gives better reward-to-risk ratios .
✔ Reversal Signals
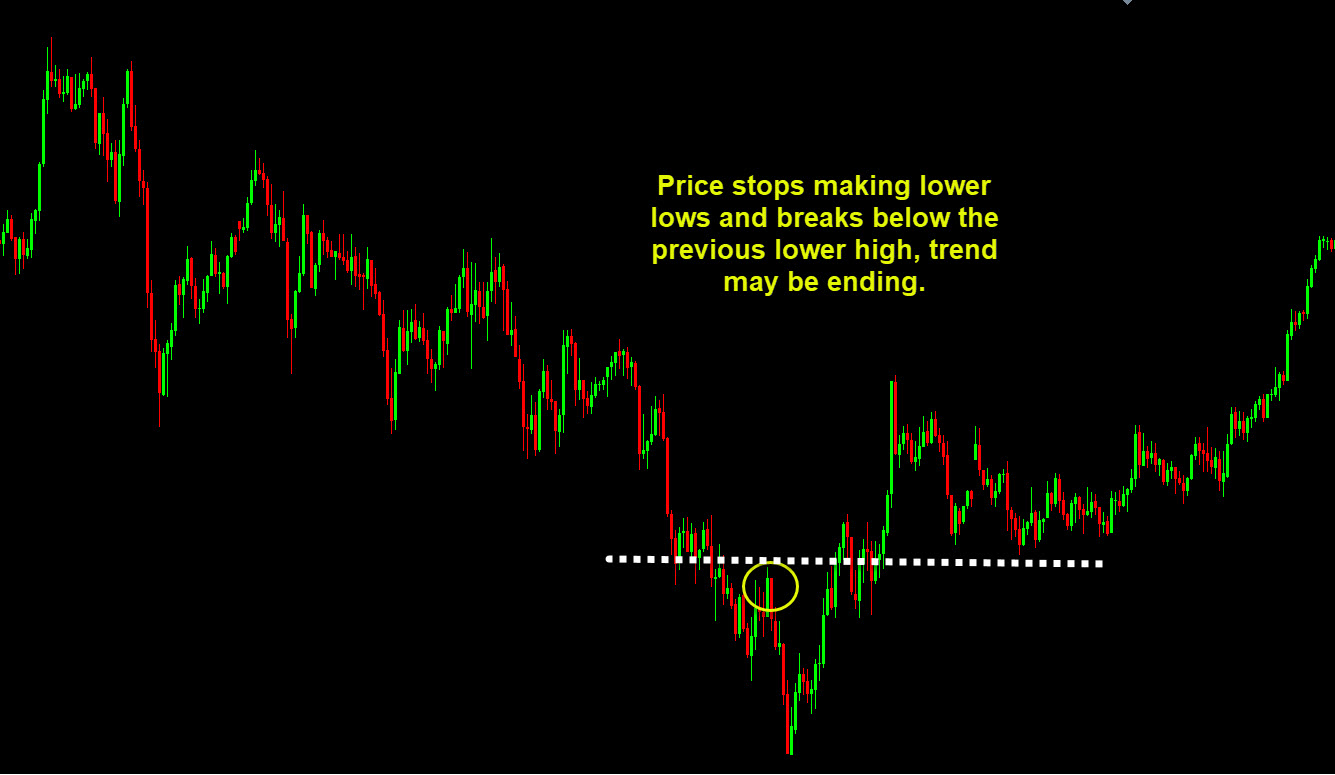
When price stops making higher highs and breaks below the previous higher low, trend may be ending.
Example:
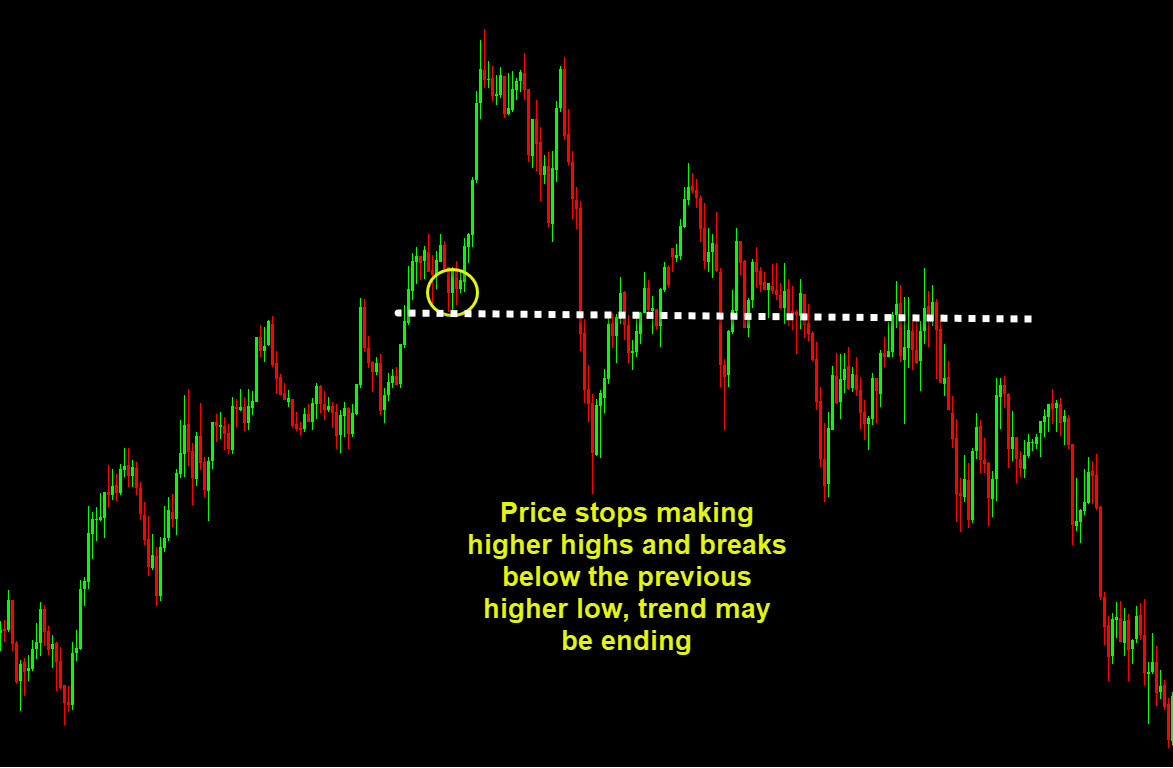
That break signals buyers couldn’t push prices higher, and sellers may be gaining control. When price stops making lower lows and breaks above the previous lower high, the trend may be ending.
Example:
7. Common Mistakes Beginners Make
Here are traps many traders fall into — and how to avoid them:
❌ Mistaking Noise for a Trend
Small swings during periods of low volatility can appear like higher highs or lower lows.
✅ Filter noise by looking at higher timeframes (H4, Daily) and waiting for solid structural swings.
❌ Using Indicators Instead of Price
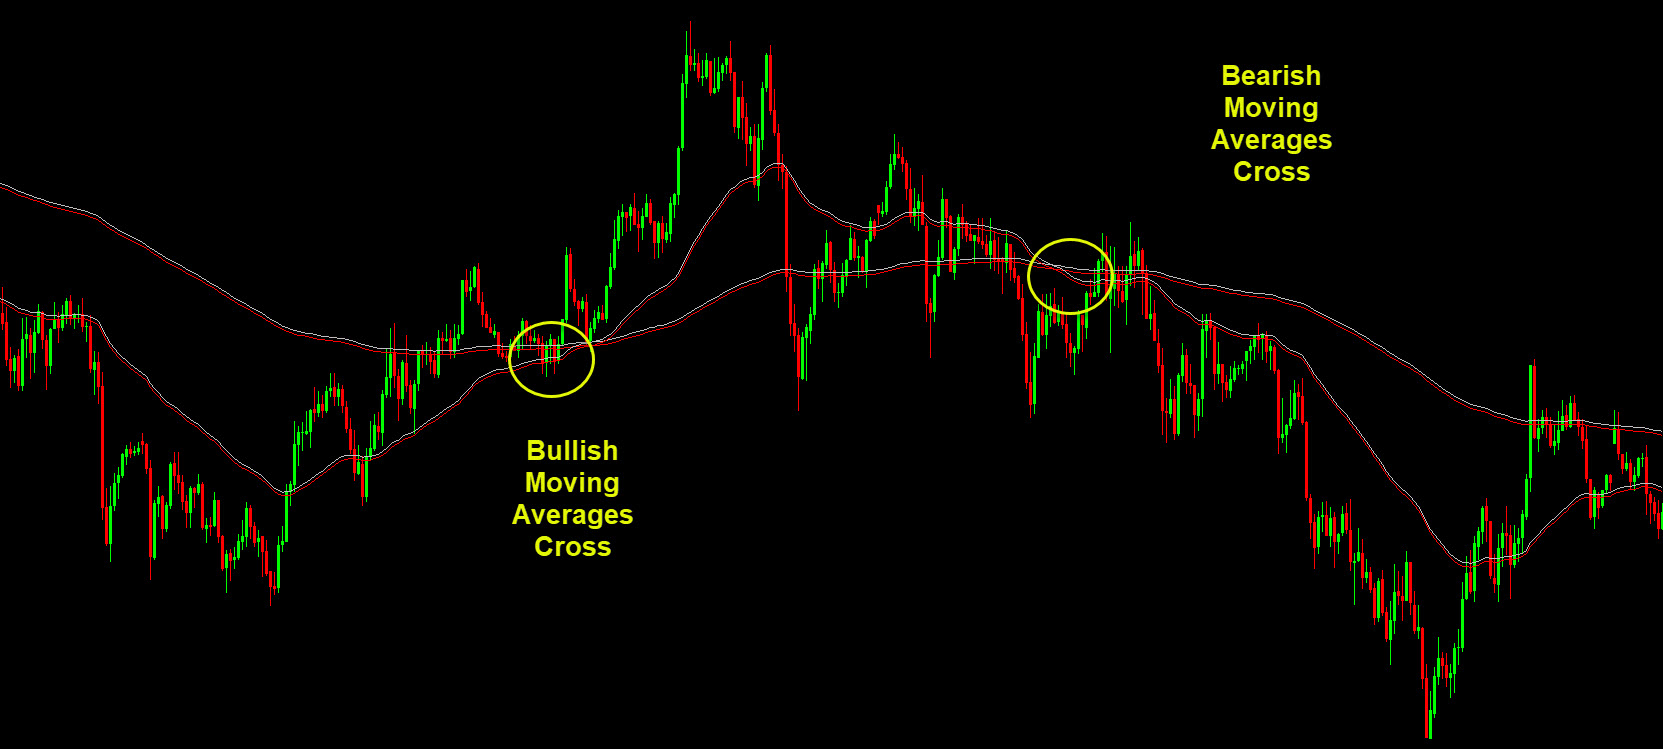
Some traders wait for moving average crosses signals instead of price structure. Price action comes first, indicators second!
✅ Price is the authority — indicators can help and confirm trading idea, but never override price action.
❌ Forcing a Trend
It’s tempting to call a trend when you want a trend.
✅ Let price show you the pattern — don’t guess it.
8. Putting It Into Practice — A Simple Checklist
Before taking a trade based on higher highs or lower lows:
✔ Identify clear directional swings ✔ Confirm at least 2 consecutive HH/HL or LL/LH ✔ Wait for a pullback to structure ✔ Use support/resistance confluence ✔ Set stop-loss beyond structural break ✔ Target logical levels (previous swing highs/lows)
9. Final Thoughts
Higher highs and lower lows are not fancy — but they are foundational. They are:
✨ Pure price action — no lag
✨ Universal across markets
✨ The backbone of trend analysis
Master this concept and you’ll see charts in a whole new way — like reading the market’s intentions in real-time.
As the market evolves, price always tells you who’s winning — if you learn to listen.