Introduction
In the world of forex trading, one of the key tasks is identifying
where the price might react. That means finding levels at which price “pauses,” “bounces,” or “breaks through.” These levels help us plan entries, exits, and risk management. Two broad categories of such levels are:
- Horizontal levels – fixed price zones (e.g., support, resistance, etc…)
- Dynamic levels – moving, changing as price evolves (e.g., moving averages, trend lines, channels)
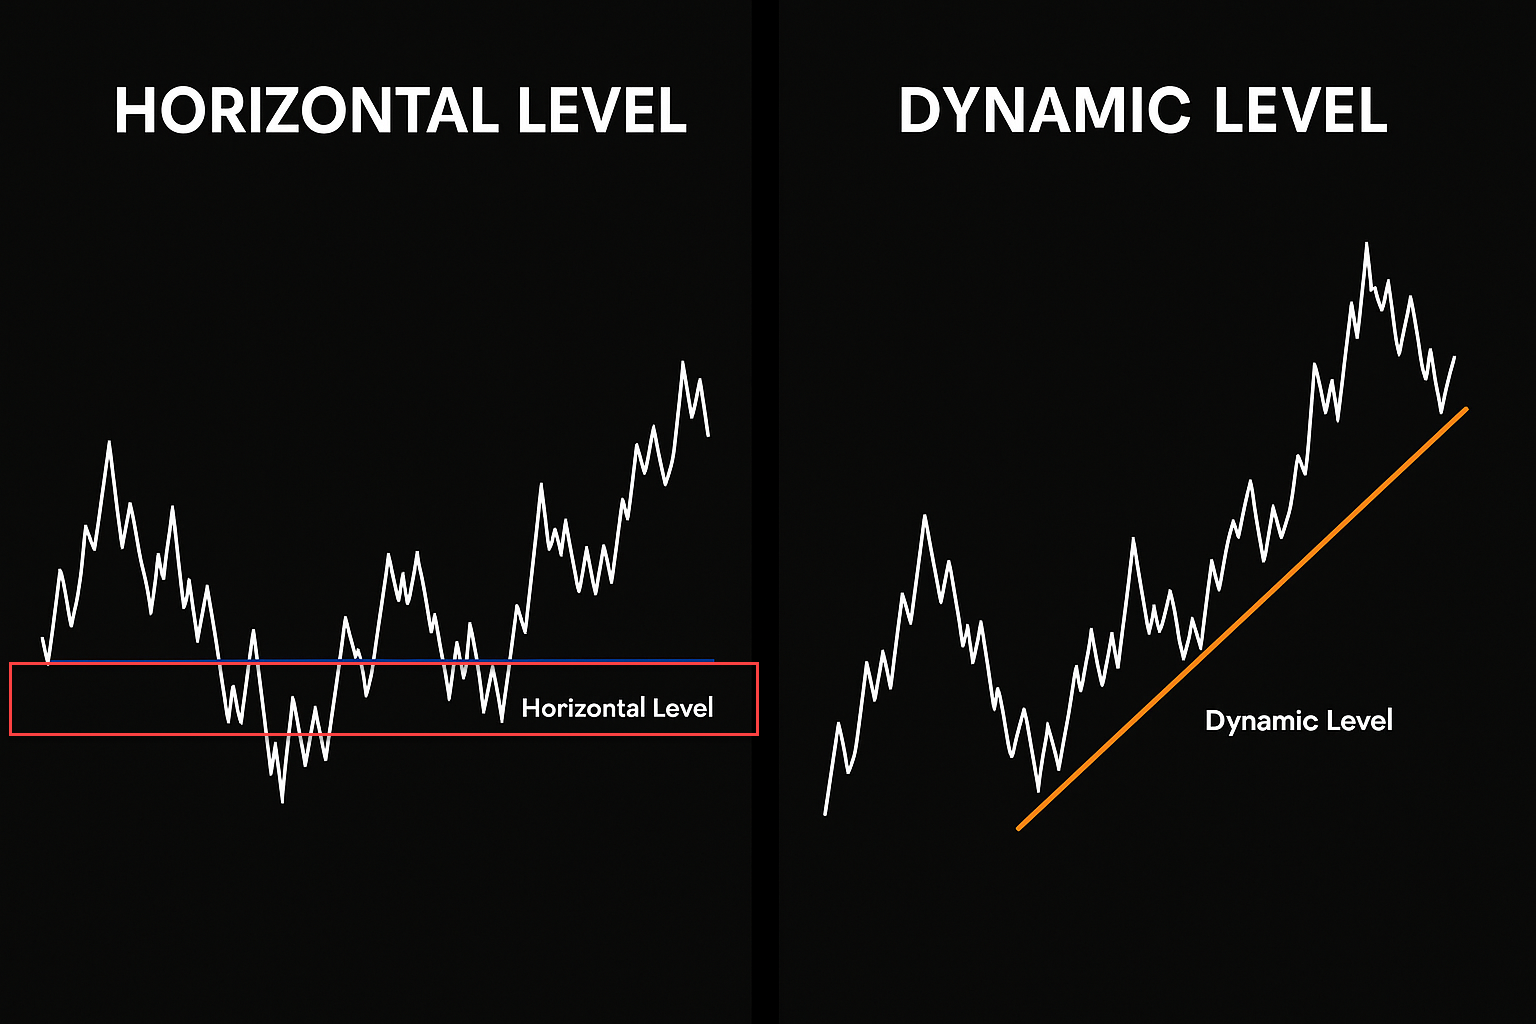
Understanding the difference, pros and cons of each, and how to use them together can give you a sharper edge in your trading.
What are Horizontal Levels?
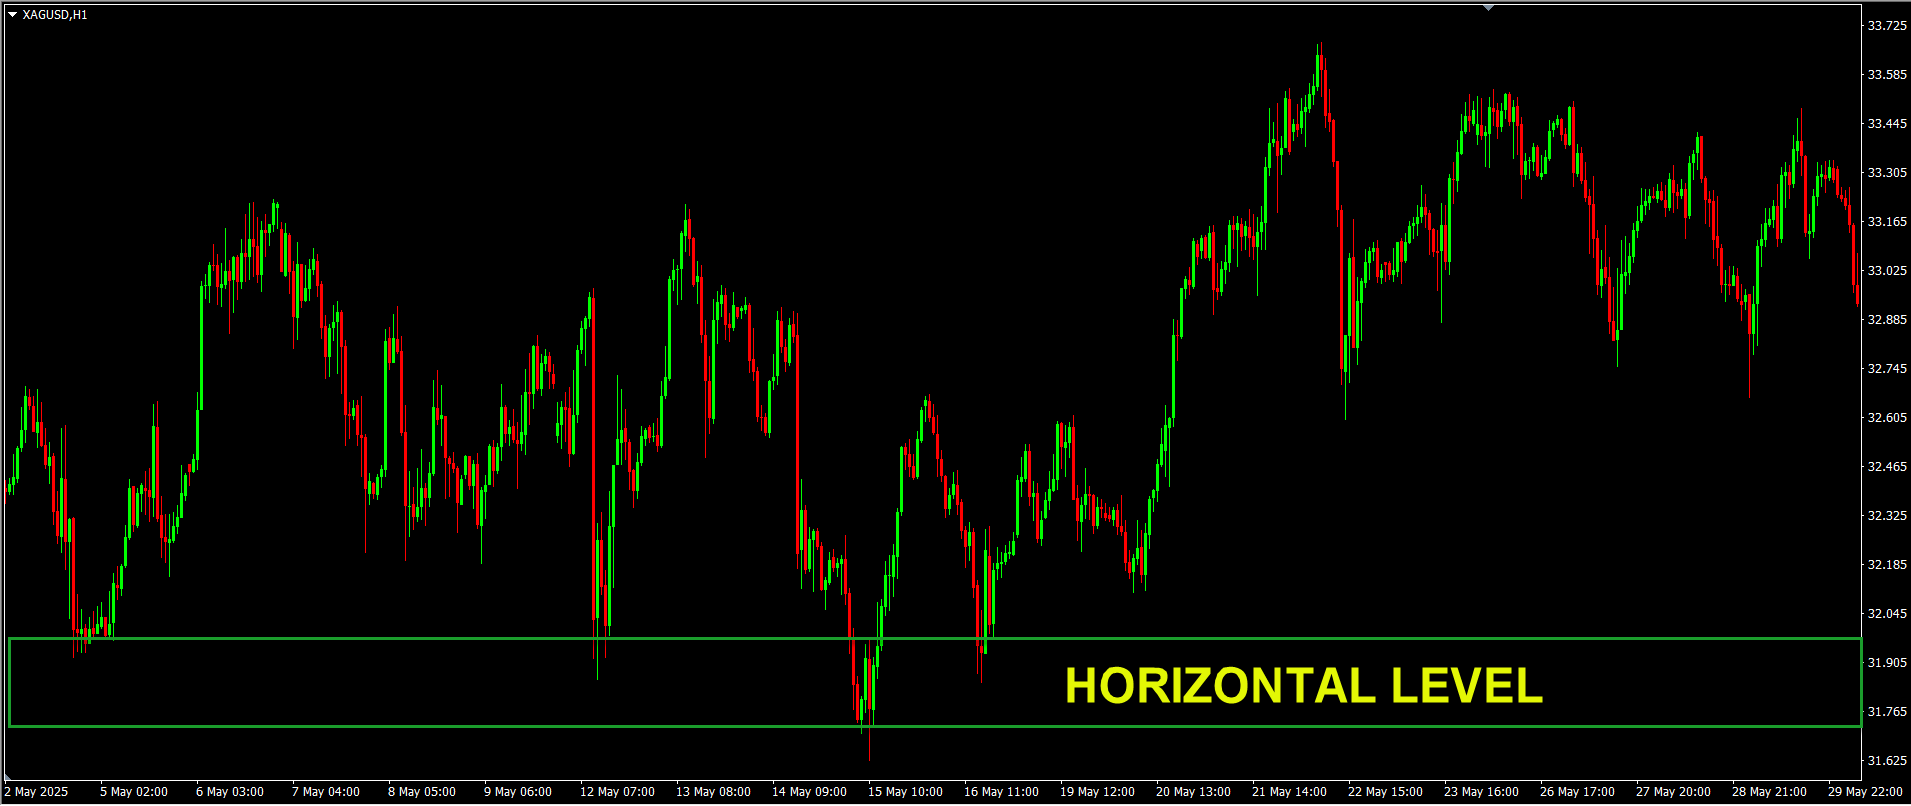
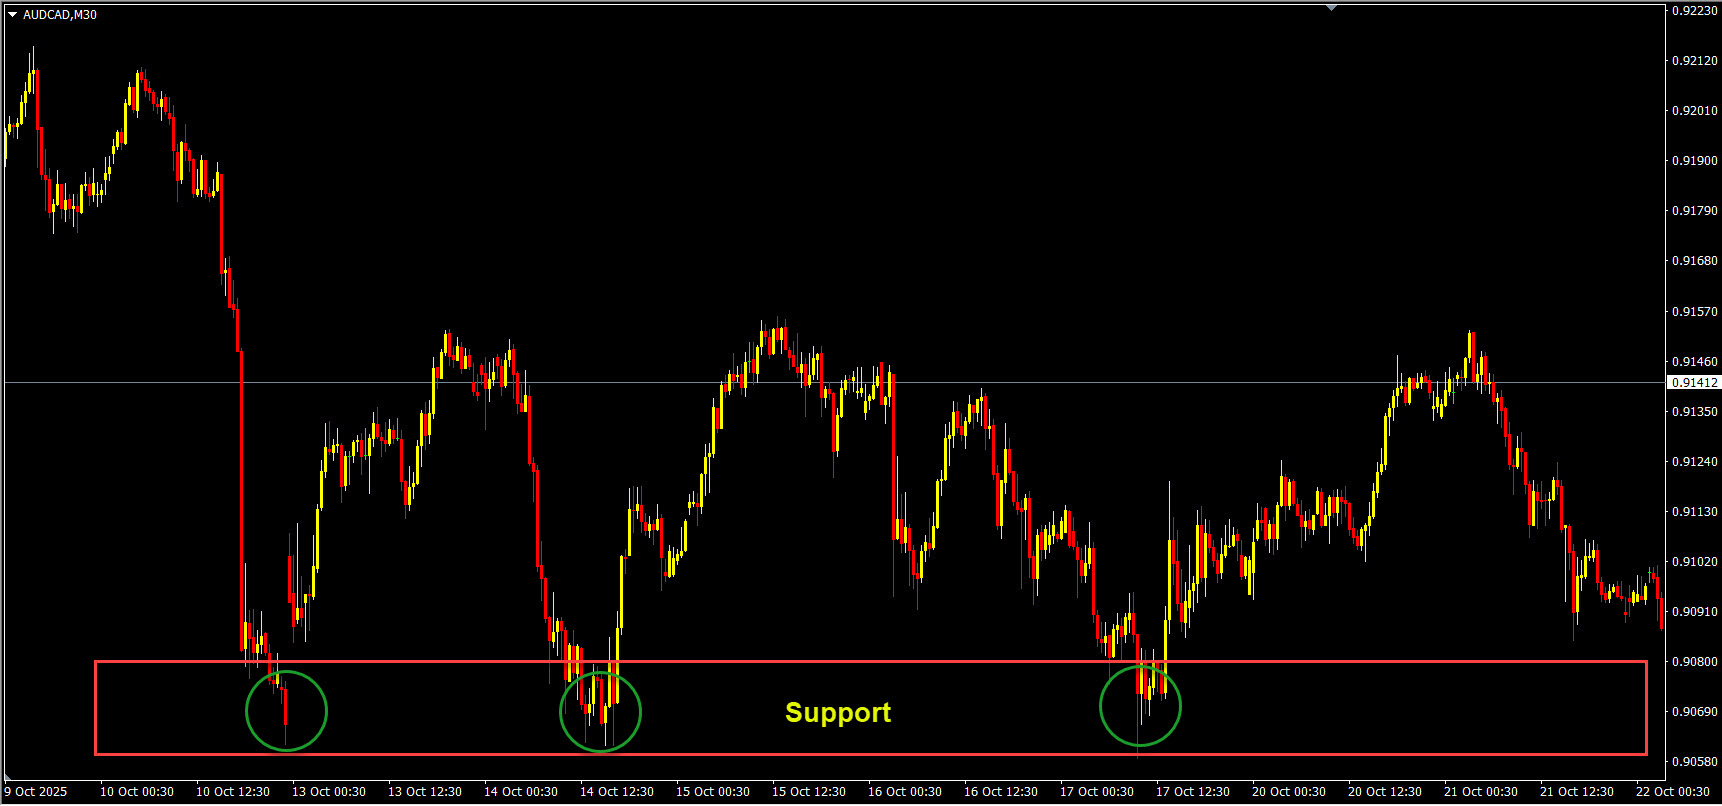
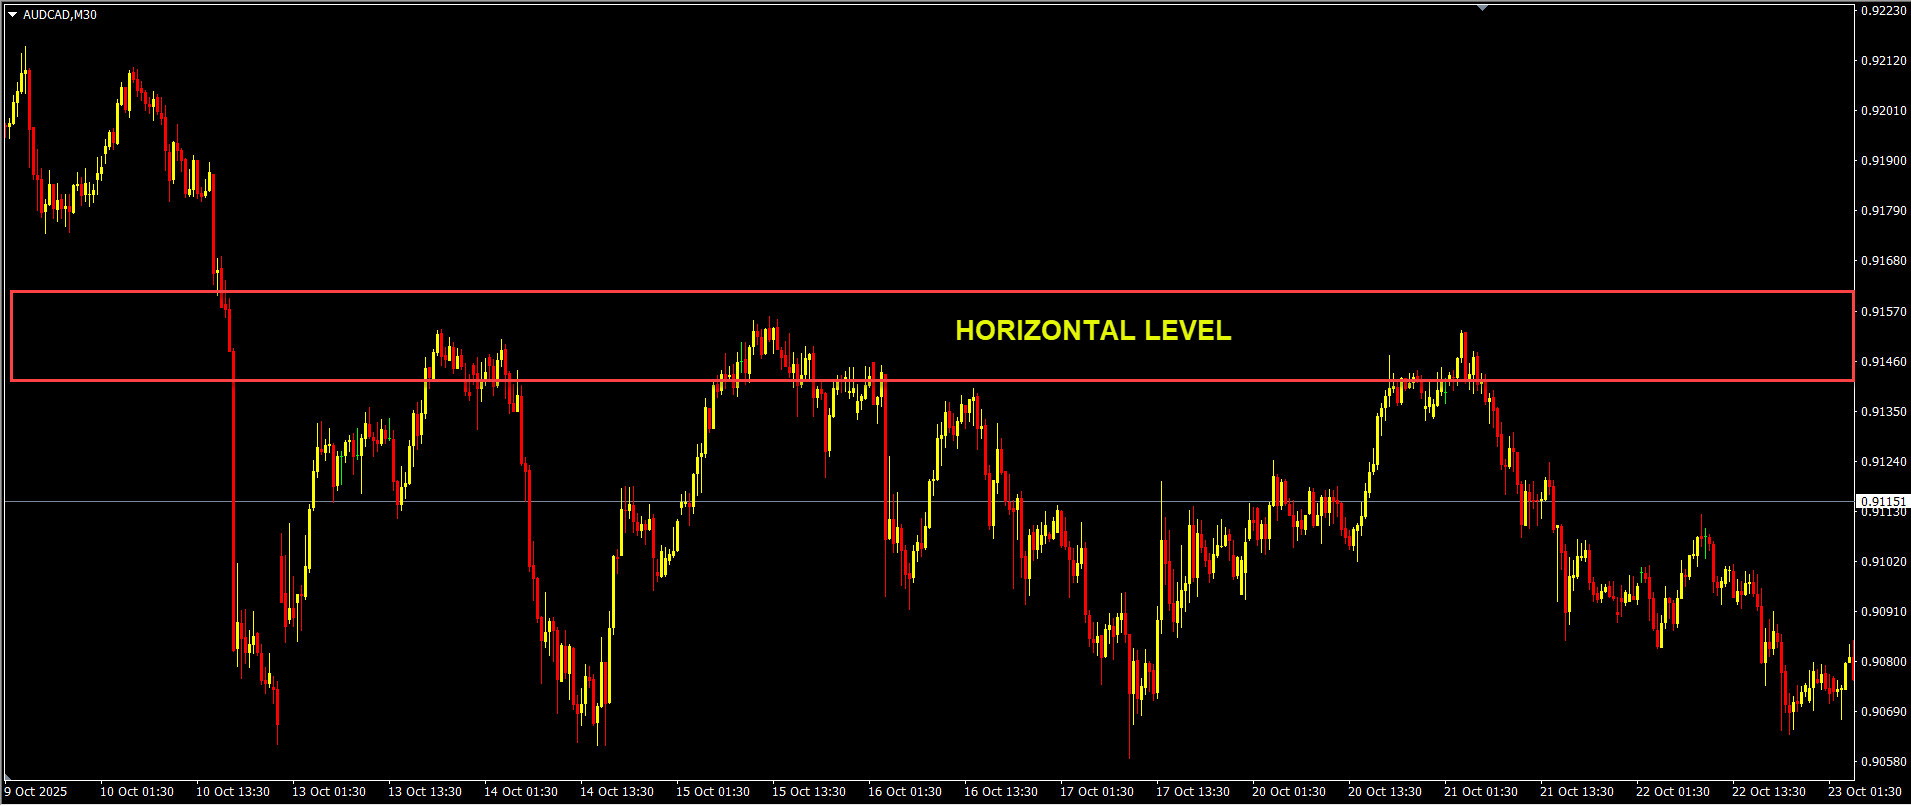
Horizontal levels are price zones drawn at fixed price values where historically prices have reacted. Think of them as flat “floors” or “ceilings” on your chart. Some common horizontal levels:
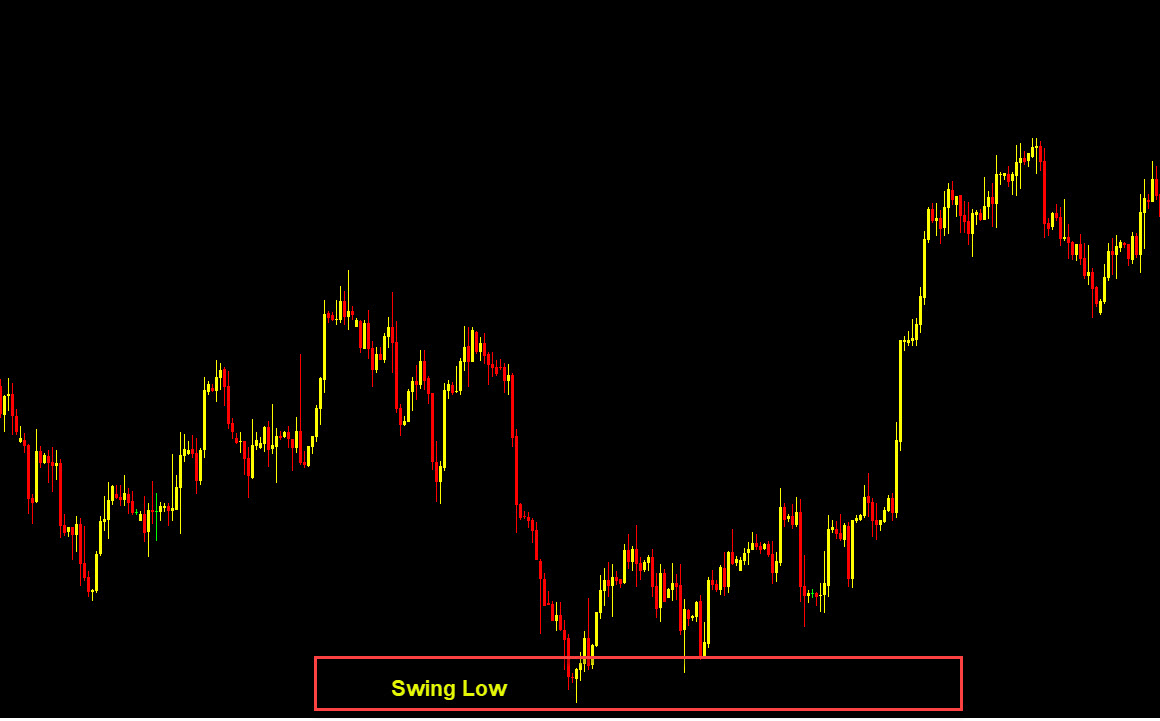
- Support: A price level below the current price where buyers came in before and pushed the price up
- Resistance: A price level above the current price where sellers come in and push the price down
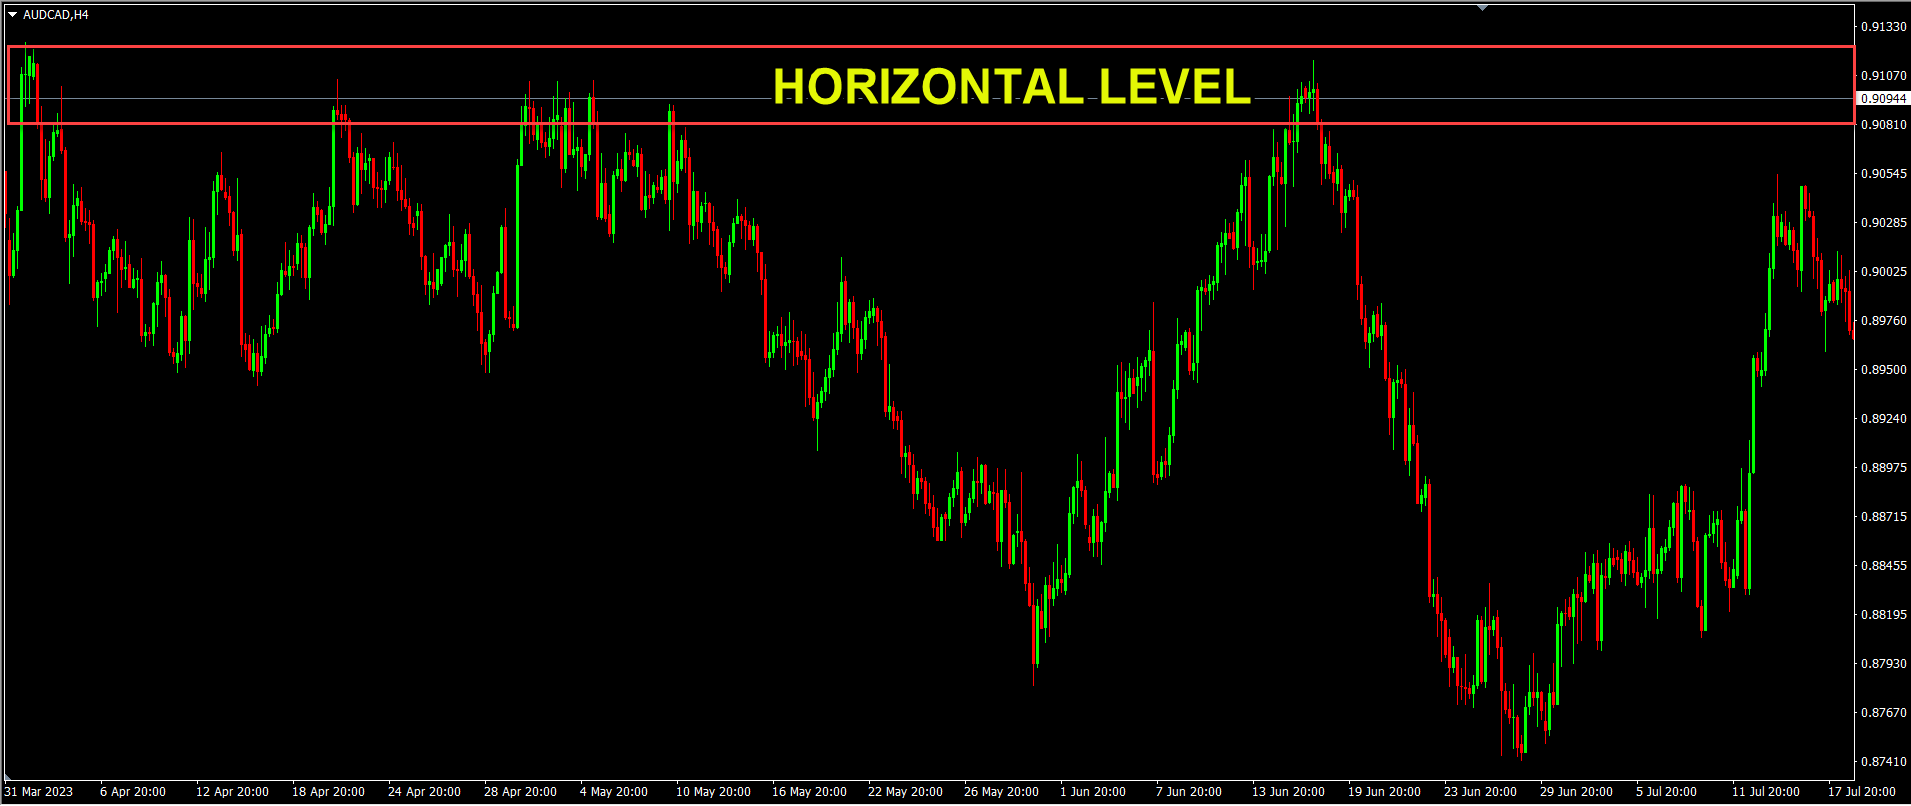
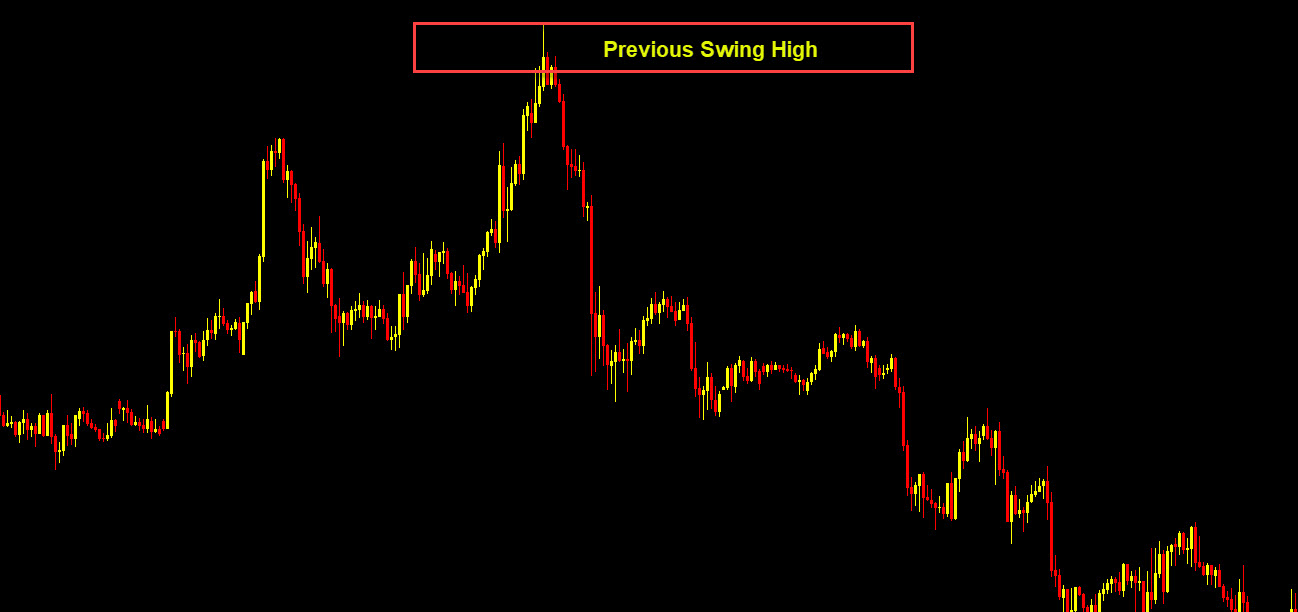
- Previous highs or lows, swing points
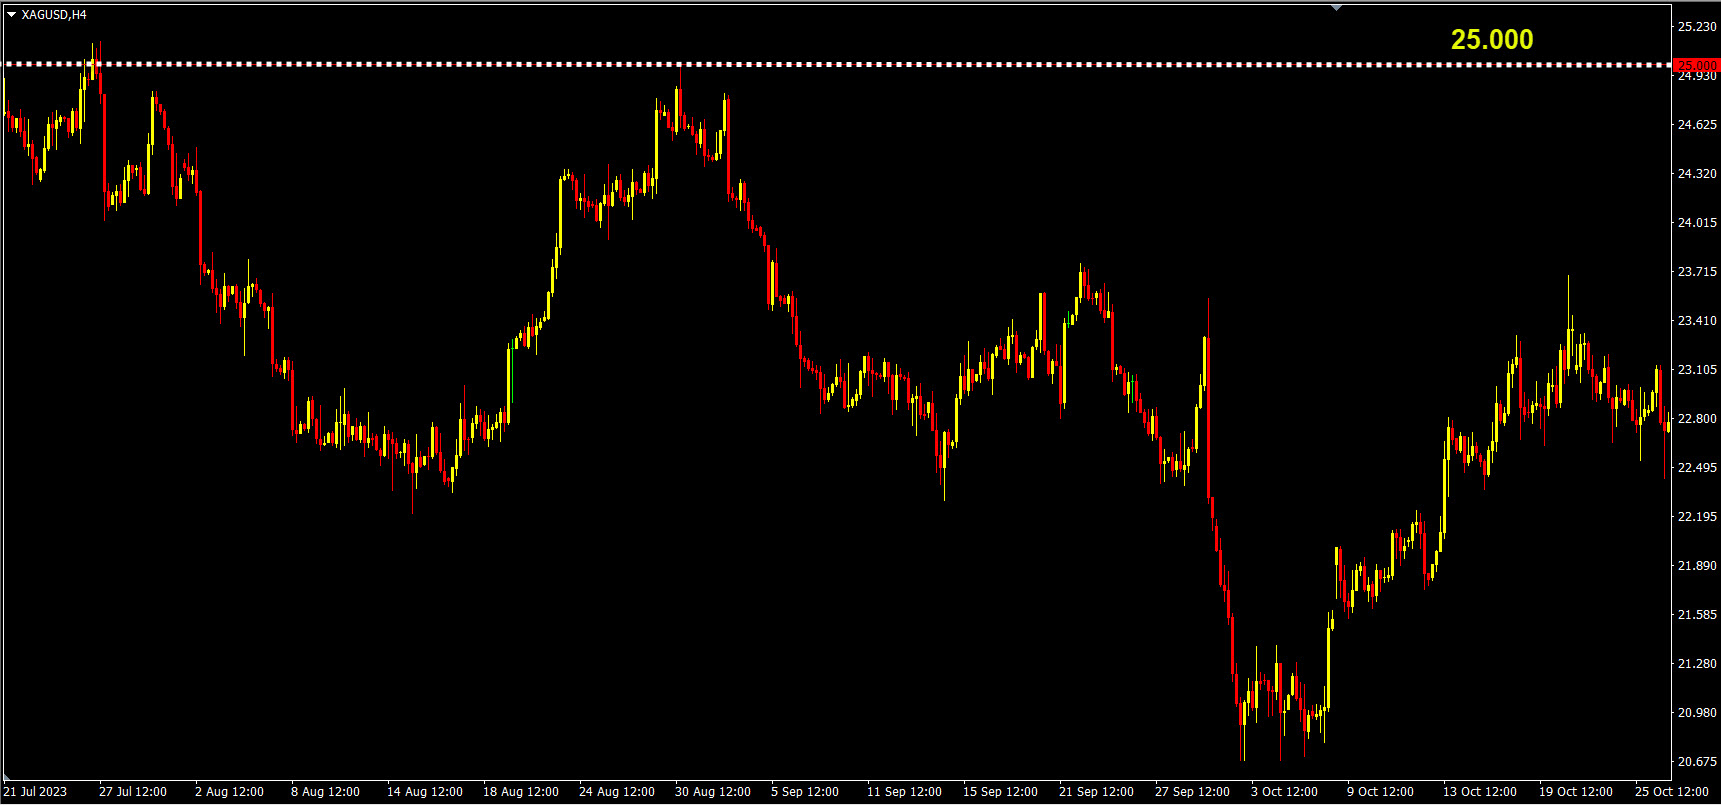
- Round numbers (psychological levels)
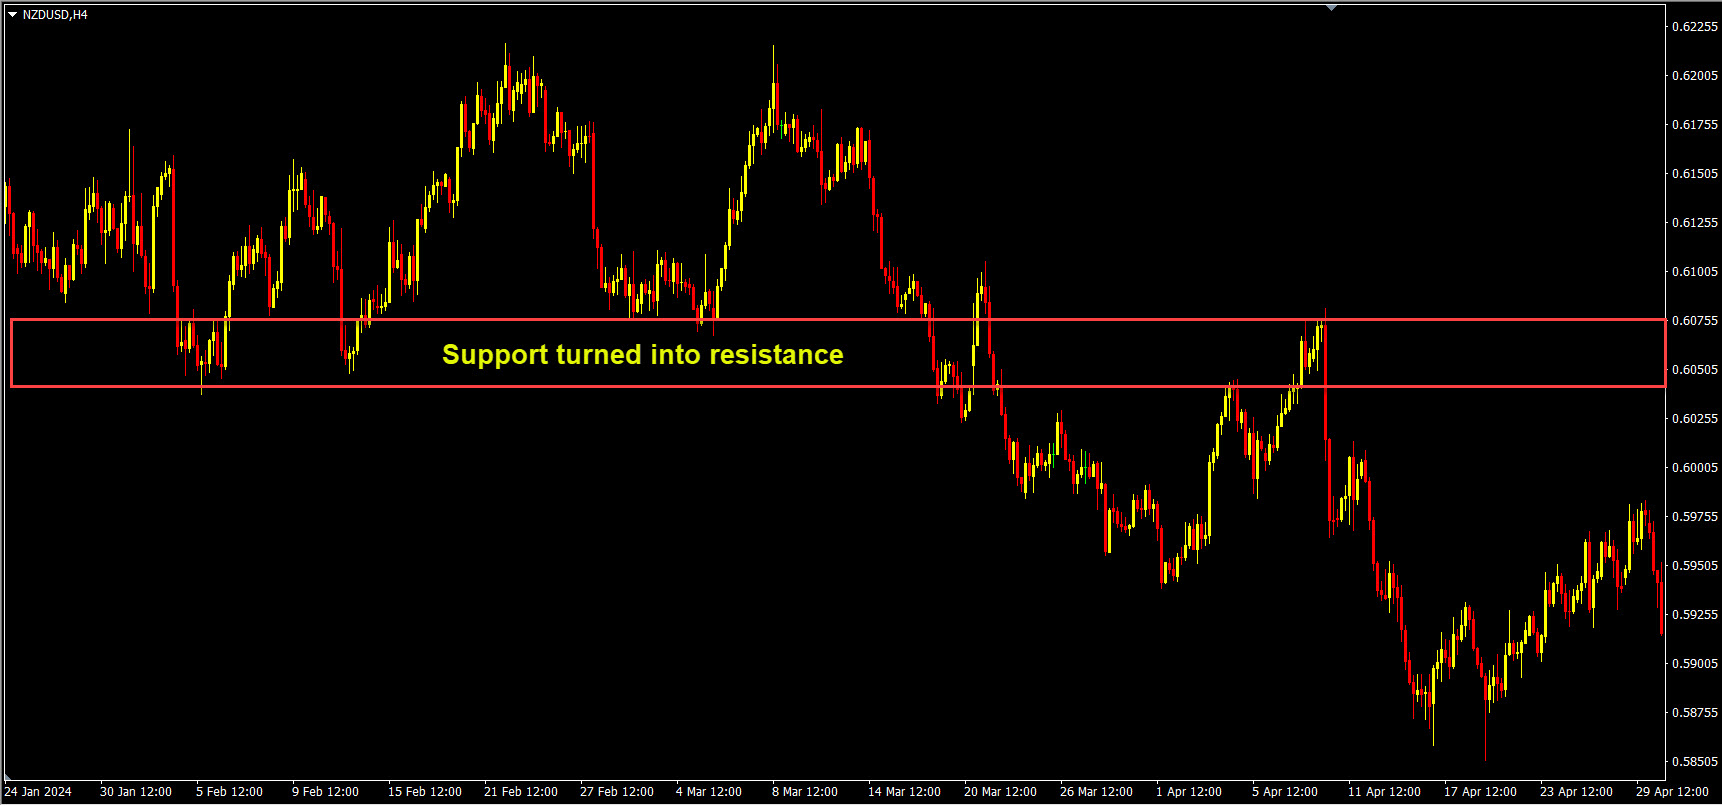
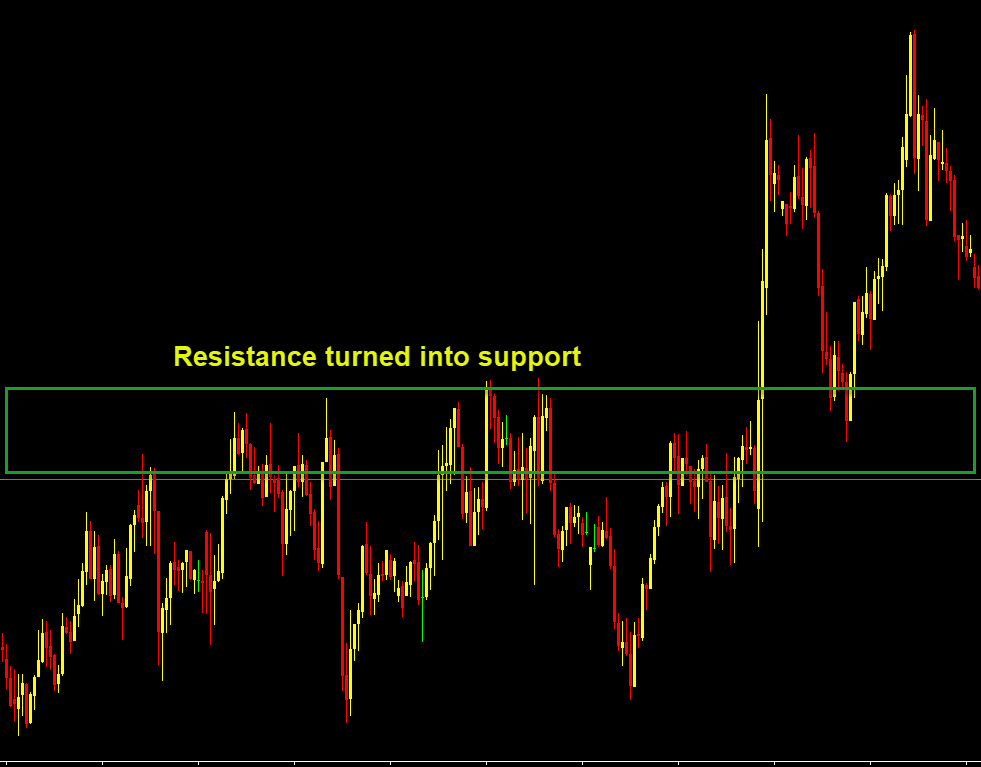
- Prior break-points turned roles (support → resistance or vice versa)
Why horizontal levels matter
- They reflect market memory: the market “remembers” that price at X level in the past had a strong reaction.
- They are visually easy to spot and consistent over time.
- They tend to attract orders (stop-losses, entries, pending orders), which creates repeatable behaviour.
- They are clear anchors for your trade planning: “If price comes down to 1.1100, I watch for a bounce.”
How to draw horizontal levels
Here’s a simple process:
- On your chart (say H4 or Daily), look for swing highs / swing lows where price reversed.
- Mark those price levels.
- See how many times price has “touched” or “reacted” there (the more touches, the stronger the level).
- Extend the line horizontally into the future to project possible reaction zones.
- Refine the zone: don’t draw a single thin line, consider a small band (because the price does not always react from an exact level).
Pros and cons of horizontal levels
Advantages:
- Simplicity: easy to identify and use.
- Stability: since they are fixed price zones, they don’t move so you can plan your trades ahead.
- Wide applicability: works in trend, range, and breakout setups.
Limitations:
- They ignore the fact that markets evolve: a level drawn yesterday may become irrelevant tomorrow.
- They can become crowded (many traders using them), which sometimes causes unpredictable reactions (fake‐outs).
- In strong trending markets, horizontal levels may be bypassed or ignored for long stretches.
What are Dynamic Levels?
Dynamic levels are price zones that move with the market. They adapt as price action evolves.
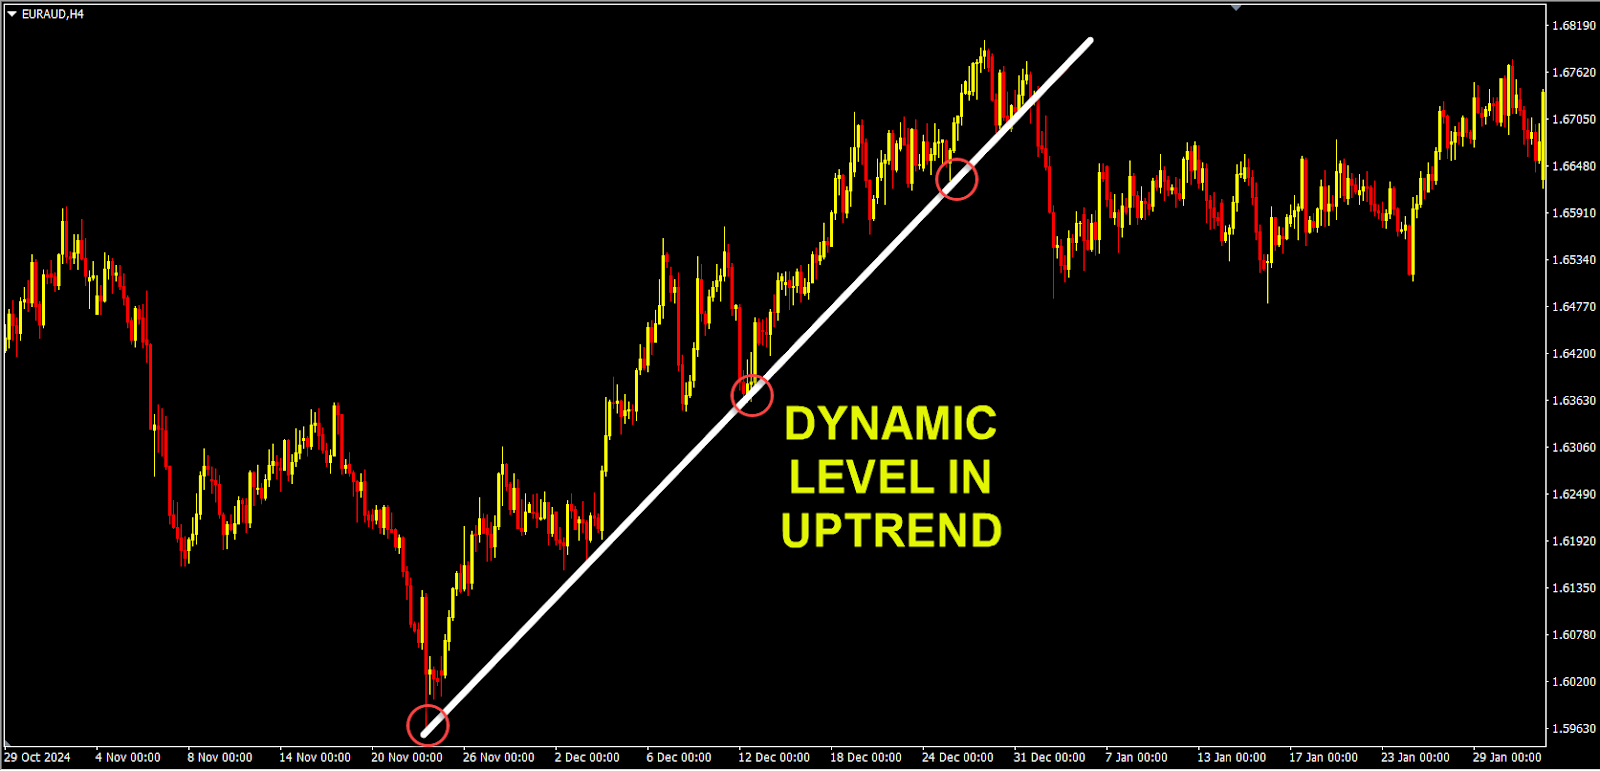
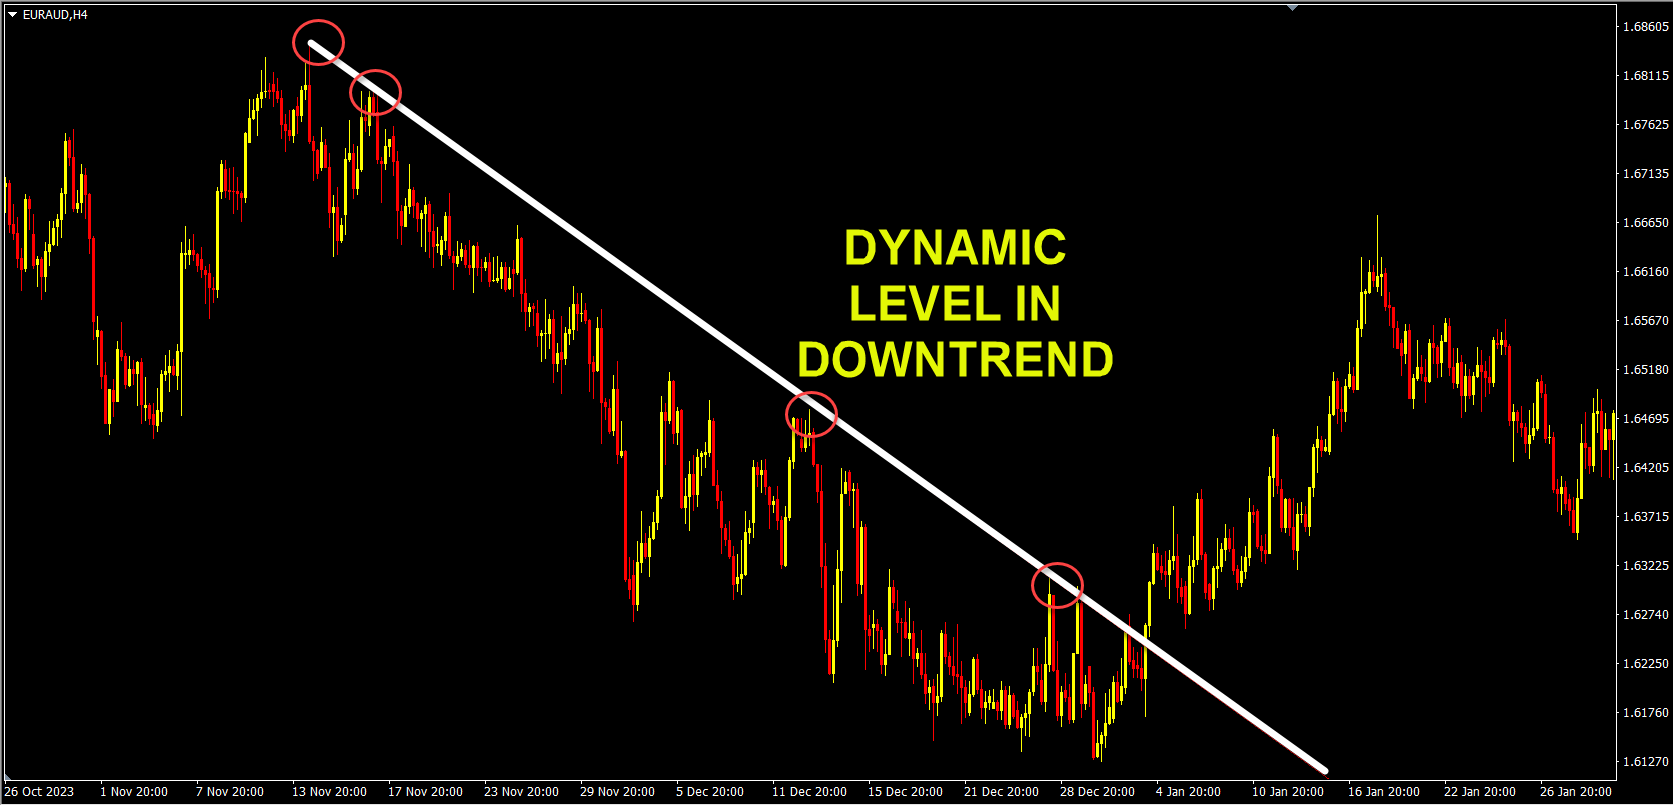
- They help capture changing market structure: For example, if the price is in an up-trend, an ascending trend line gives you where to expect a reaction rather than a fixed flat line.
- They offer moving support or resistance, which can be especially useful in trending markets.
- They bring in the notion of time along with price: the same price but at a later time may mean something different when following a sloping line.
How to draw dynamic levels
Here’s a method:
- Identify a clear trend (up or down) on your preferred timeframe.
- For a trend line: connect two or more swing lows (in an up-trend) or swing highs (in a down-trend).
- For channels: draw a parallel line from the first touch of the trend line to the opposite side of the price action.
- For moving averages: choose your period (e.g., MA 50), apply it, and observe how price interacts with it.
- Note: these levels are valid only as long as the structure holds. If trend breaks, dynamic level may collapse.
Here is an example from the chart
Pros and cons of dynamic levels
Advantages:
- They adapt to the market environment: trending or rotating.
- They allow you to plan in trend trades (which often carry bigger rewards).
- Provide flexible zones where price can “ride” the level rather than bounce off it.
Limitations:
- Subjectivity: drawing trend lines or selecting periods for moving averages can differ from one trader to another.
- They may not provide as strong an “anchor” as horizontal levels (which have many prior touches).
- They can become less meaningful when price action is choppy or range-bound (since the slope or movement may be weak).
Horizontal vs Dynamic – Side-by-Side Comparison
| Feature |
Horizontal Levels |
Dynamic Levels |
| Fixed or moving |
Fixed price zone |
Moves with time / structure |
| Best used when |
Market is in range / reaction zone / consolidation |
Trending markets / evolving structure |
| Ease of identification |
Relatively straightforward (prior swing highs/lows) |
Requires trend detection, more skill |
| Strength / reliability |
Strong when many touches, clear history |
Strength depends on trend validity, less history |
| Planning entries/exits |
Clear targets, defined zones |
Potential for “ride the trend” entries, trailing exits |
| Risk management role |
Easier to place clear stop-loss outside the zone |
More flexible stops/trails, but perhaps less defined initially |
How to Use Both Together – A Practical Framework
Rather than choosing one exclusively, a smart trader uses
both horizontal and dynamic levels in their toolbox. Here is a step-by-step framework you can adopt:
Step 1: Identify the broader market context
- Is the pair in a clear trend (higher highs & higher lows / lower lows & lower highs) or is it range-bound (swinging between support and resistance)?
- On a higher timeframe mark the trend, major horizontal levels.
Step 2: Mark the horizontal levels
- On your chart, note the major support/resistance zones: previous swing highs/lows, psychological levels,and major round numbers.
- Label them: “major Horizontal Support”, “Horizontal Resistance”, etc.
Step 3: Overlay dynamic structure
- If in trend: draw a trend line, or channel, or apply a moving average that has shown significance (price uses it as support/resistance).
- Observe how the price behaves around that dynamic level.
Step 4: Look for confluence
- Confluence = where a dynamic level intersects (meets) a horizontal level. These are high-probability zones because both types of levels reinforce each other.
- Example: a falling trend line meets a horizontal resistance zone.
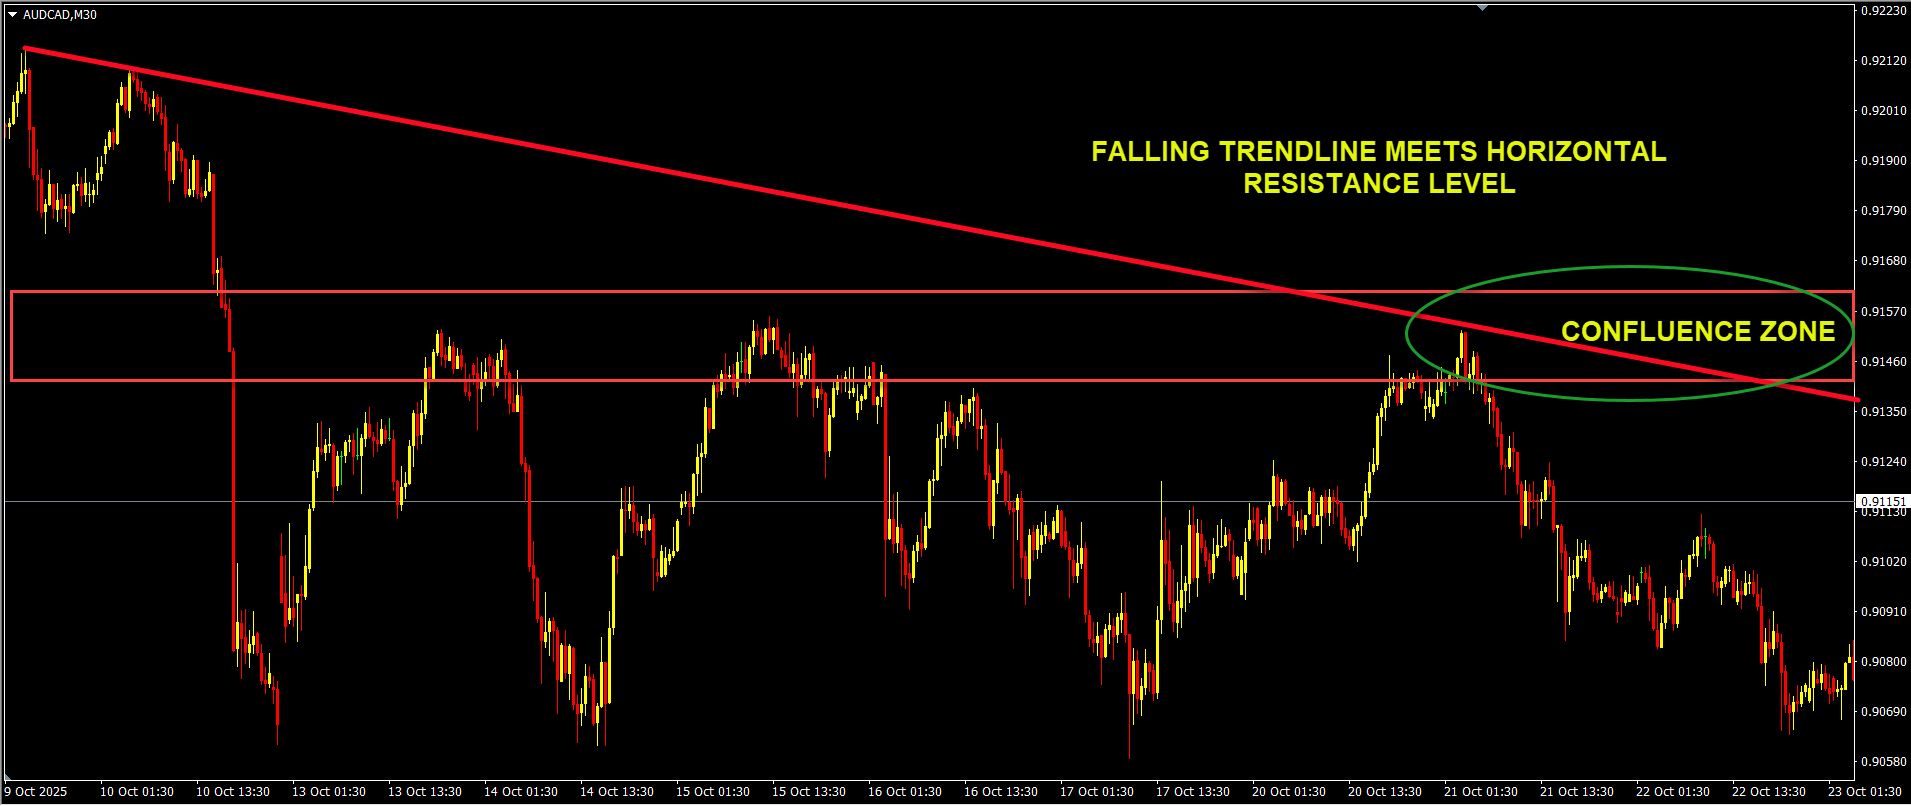
- When you find a confluence zone you can plan entries with tighter risk and better reward.
Step 5: Entry planning
- Wait for reaction at the zone: a rejection candle, a bounce, a false break, then recovery.
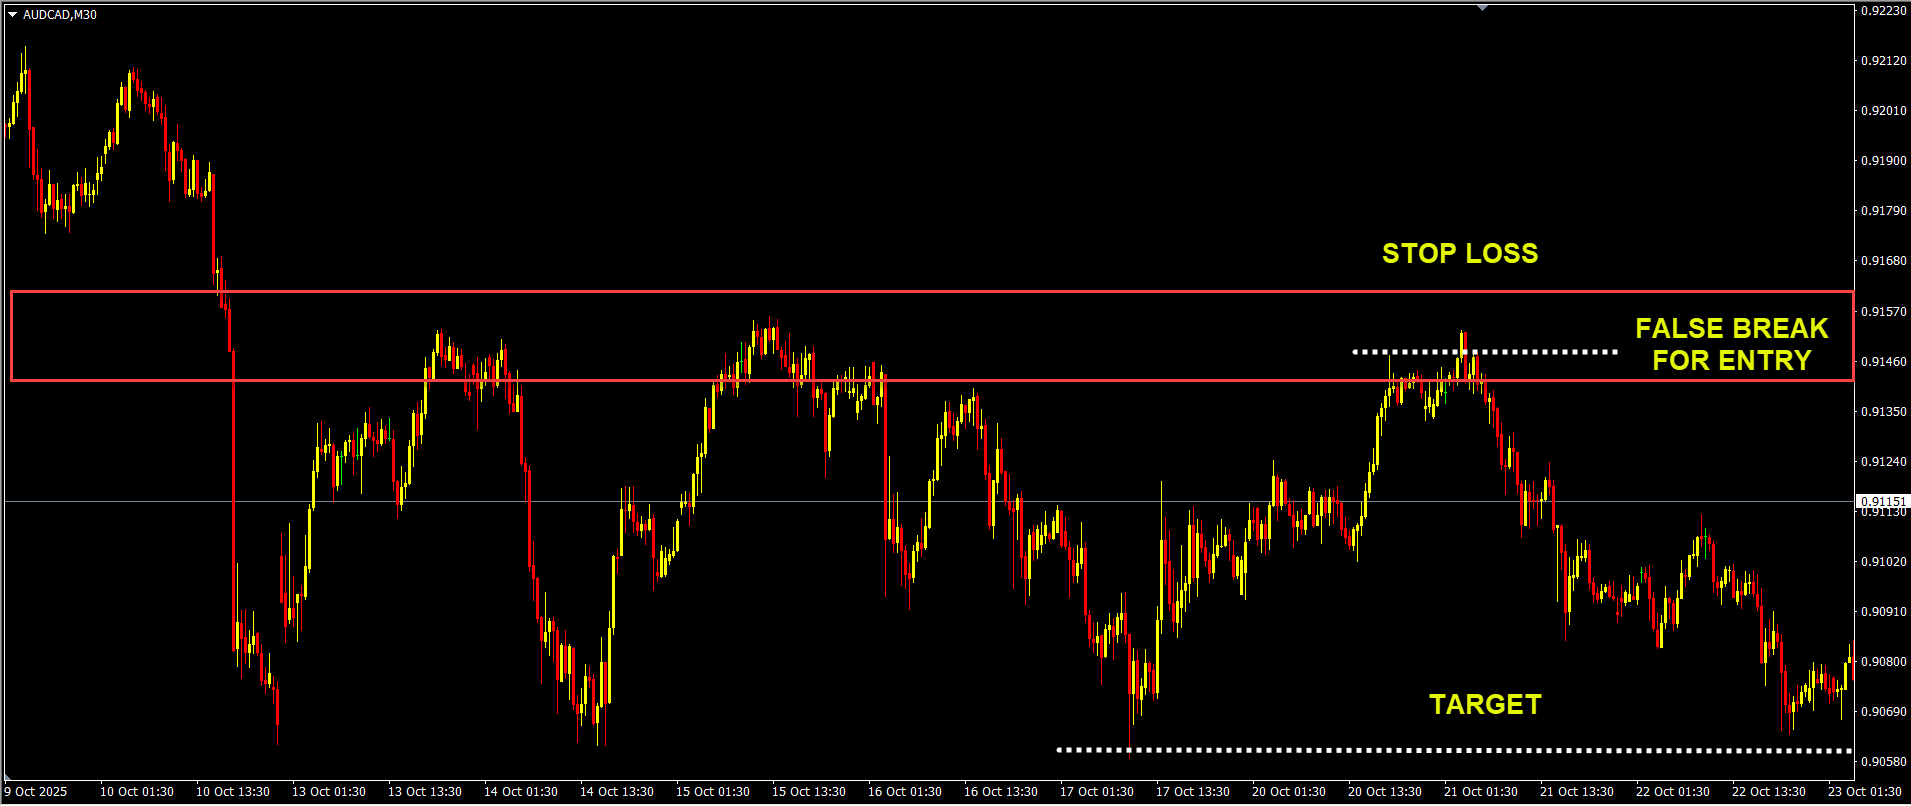
- Place your stop-loss just beyond the zone (horizontally: just beyond the horizontal; dynamically: just beyond the trend line or MA).
- Set your target(s) based on the next horizontal level or channel boundary.
Step 6: Managing the trade
- If you’re using a dynamic structure (trend line/channel), you may trail your stop along the dynamic level (for example moving the stop as price respects the trend line).
- If you’re primarily using horizontal levels in a range, you might use fixed stops and targets aligned with the next level.
Step 7: Exit or adjust when structure breaks
- If the trend line breaks (dynamic level fails), you may switch to a new plan: price might convert to range behaviour (so horizontal levels become more relevant).
- If a horizontal level breaks convincingly, you may shift your plan to follow the breakout and look for dynamic pull-backs to this level turned new role.
Key Pitfalls & Mistakes to Avoid
As with any trading tool, horizontal and dynamic levels are not fool-proof. Here are common mistakes and how to avoid them:
- Over-drawing many levels
- Mistake: Drawing dozens of horizontal lines “just in case”.
- Fix: Only mark levels that have meaningful history (2+ touches or strong reaction). Keep the chart clean.
- Ignoring time context
- Mistake: Using a dynamic trend line from a very minor swing in a multi-year chart and expecting it to hold.
- Fix: Always match your timeframe to your trading style. Swing trades use Daily/4-H, scalps maybe 15-min.
- Assuming a level will always hold
- Mistake: Thinking “this horizontal support must hold” and going long without a signal.
- Fix: Use level as an area of interest, not a guarantee. Wait for confirmation (price action signal).
- Using dynamic levels alone in a range market
- Mistake: Applying a trend line in a flat market and expecting strong reactions.
- Fix: Recognize when the market is trending vs ranging and adapt: in range, horizontal levels dominate.
- Not adapting when the structure breaks
- Mistake: Clinging to a trend line after the price has broken it repeatedly.
- Fix: If a dynamic level fails (break + retest in opposite direction) or a horizontal level breaks convincingly (close beyond it + volume), adjust your plan: new level, new trend, or new range.
Final Thoughts
In the world of forex, successful traders don’t rely on guesses—they rely on
structure: defined levels, defined risk, defined reward. Horizontal and dynamic levels are two of the most robust structural tools in your charting arsenal. Use them wisely: identify them, respect them, but don’t treat them as magic. Every trade still demands discipline, patience, and a plan.
If you practise this approach patiently—marking levels, waiting for a signal, then executing and managing—you’ll gradually build confidence in reading the market structure. Over time, you’ll start
seeing the zones where price is likely to react, and your trading will feel more grounded and less random.