1. Why Support & Resistance Matter
Understanding what we mean by “support” and “resistance” is more than just drawing lines on a chart — these are
price levels where behaviour changes, and that makes them invaluable for you as a trader in the forex market.
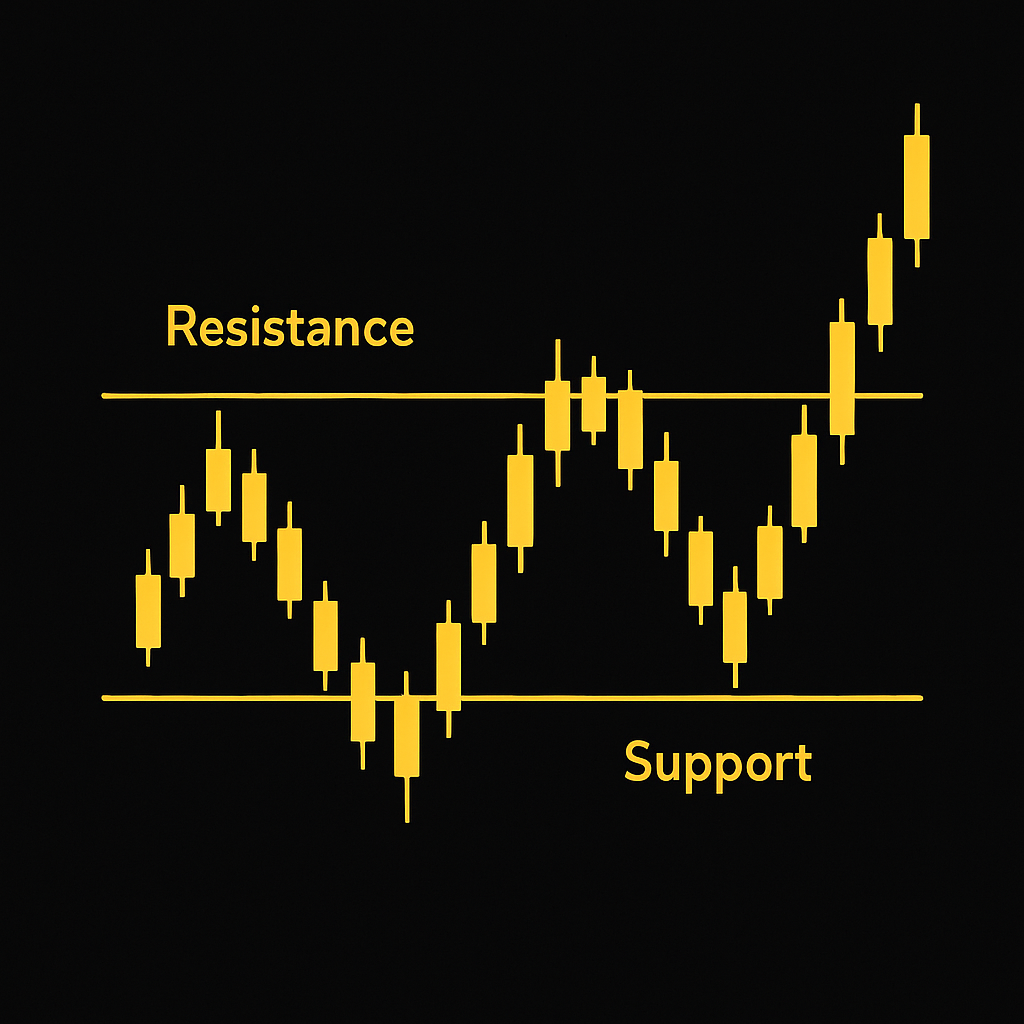
- Support = a price level where buyers tend to step in, halting a price decline and often causing a bounce.
- Resistance = a price level where sellers tend to step in, stopping an up-move and often causing a reversal or pause.
- Why it works: Markets are driven by supply & demand. When demand > supply, you get support and buyers control; when supply > demand, you get resistance and the control goes to the sellers.
- Why it matters for trading: These levels become decision zones — places where you can look for bounce trades, breakout trades, or simply manage risk better.
In short: if you can identify
good support & resistance levels, you increase your probability of making
higher-quality entries, tighter stops, better risk/reward and more confidence.
2. What Makes a “Key” Level?
Not every line you draw is worth trading. Some levels are more meaningful than others. Let’s dig into what separates the good ones from the weak ones.
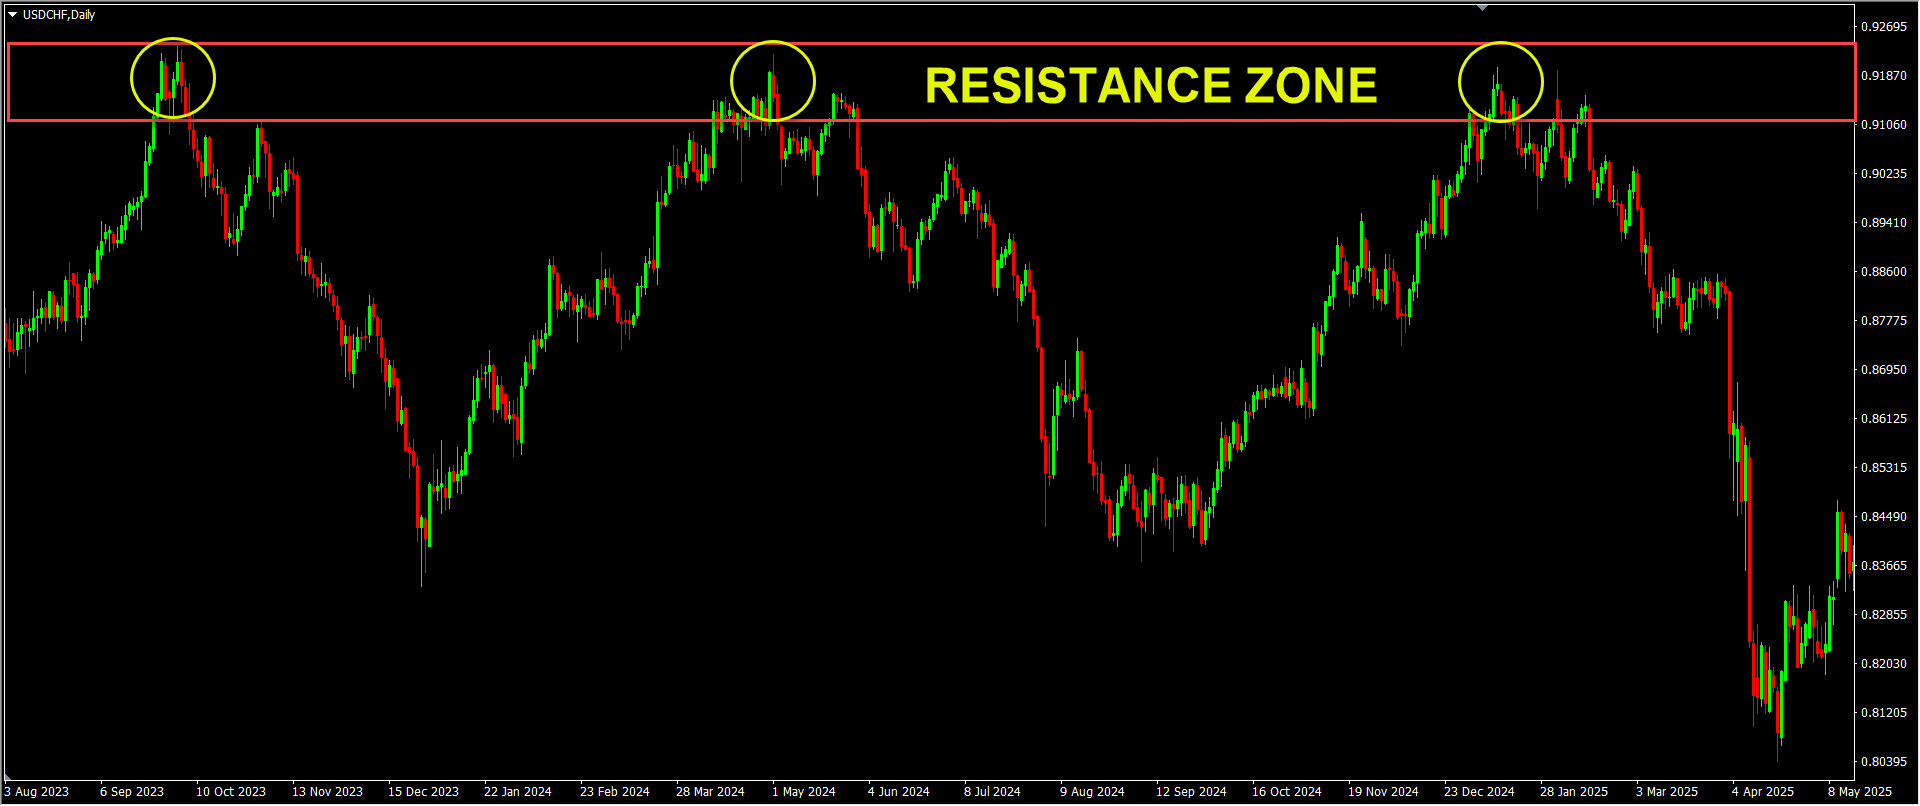
2.1 Frequency of Tests
- The more times the price has touched a level and respected it (bounced or reversed) in the past, the more likely traders will see it and act around it. In academic work, levels with more past bounces show higher chances of future bounce.
- So check the history of the pair: how many times the price touched that horizontal zone?
2.2 Time-frame & Context
- A support level on a weekly chart will almost always hold more weight than one drawn just on a 5-minute chart. Larger time-frames = more participants, more institutional interest, bigger money flow and therefore more reliable levels.
- Also, consider the trend context. Support in a strong downtrend is weaker than support in a consolidation or uptrend.
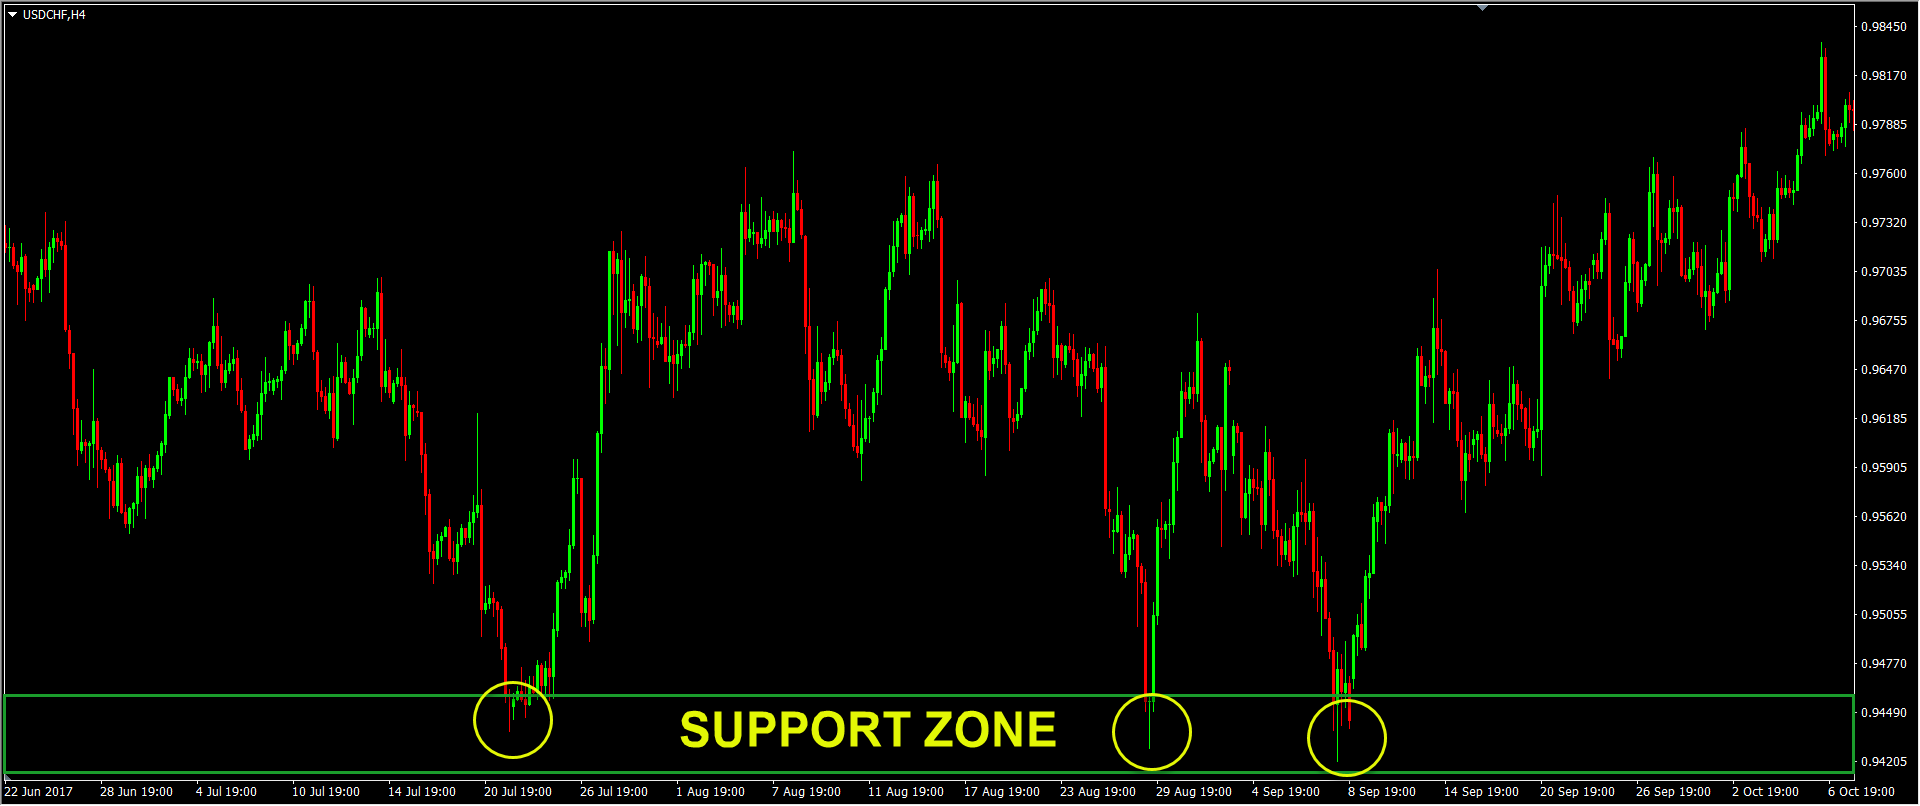
2.3 Zone vs. Line
- Many traders draw a single line. Better approach: think zone (for example: 1.1830-1.1850 on EUR/USD) rather than an exact 1.1842. Because market noise means the price will rarely hit a perfectly neat line.
- The “zone” acknowledges wicks, shadows, spread, etc.
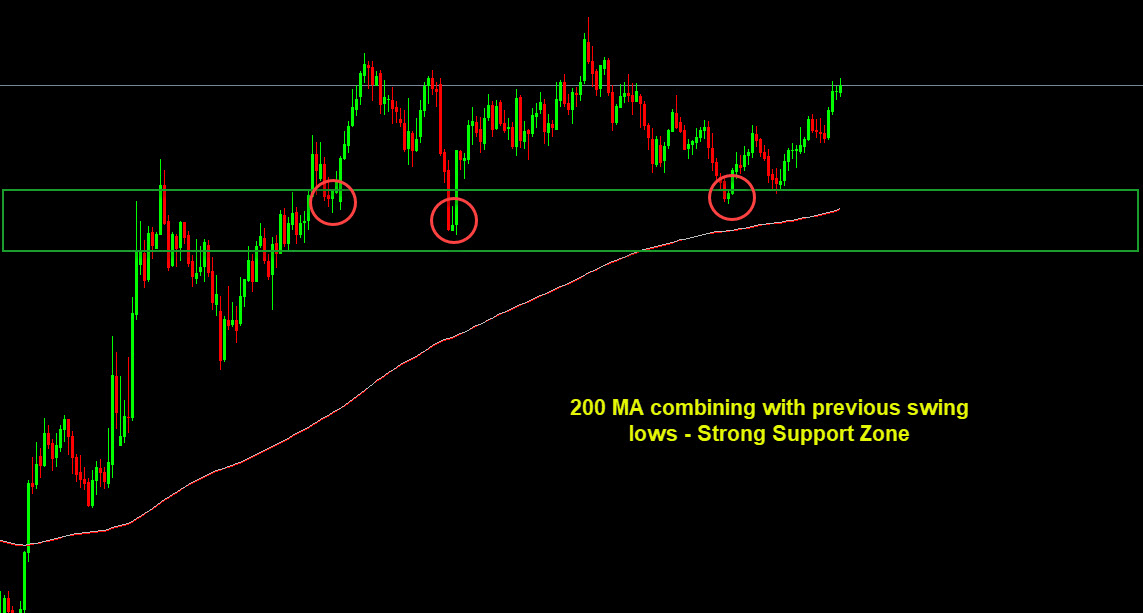
2.4 Confluence of Methods
- When a support/resistance level is backed up by additional tools (trend-line, moving average, pivot, round number) the reliability goes up.
- Example: a 200-hour MA combining with the previous swing lows → stronger support.
2.5 Psychological / Round Numbers
- For example: Levels like 1.20000, 0.60000 often act as “magnets” because many traders place orders there.
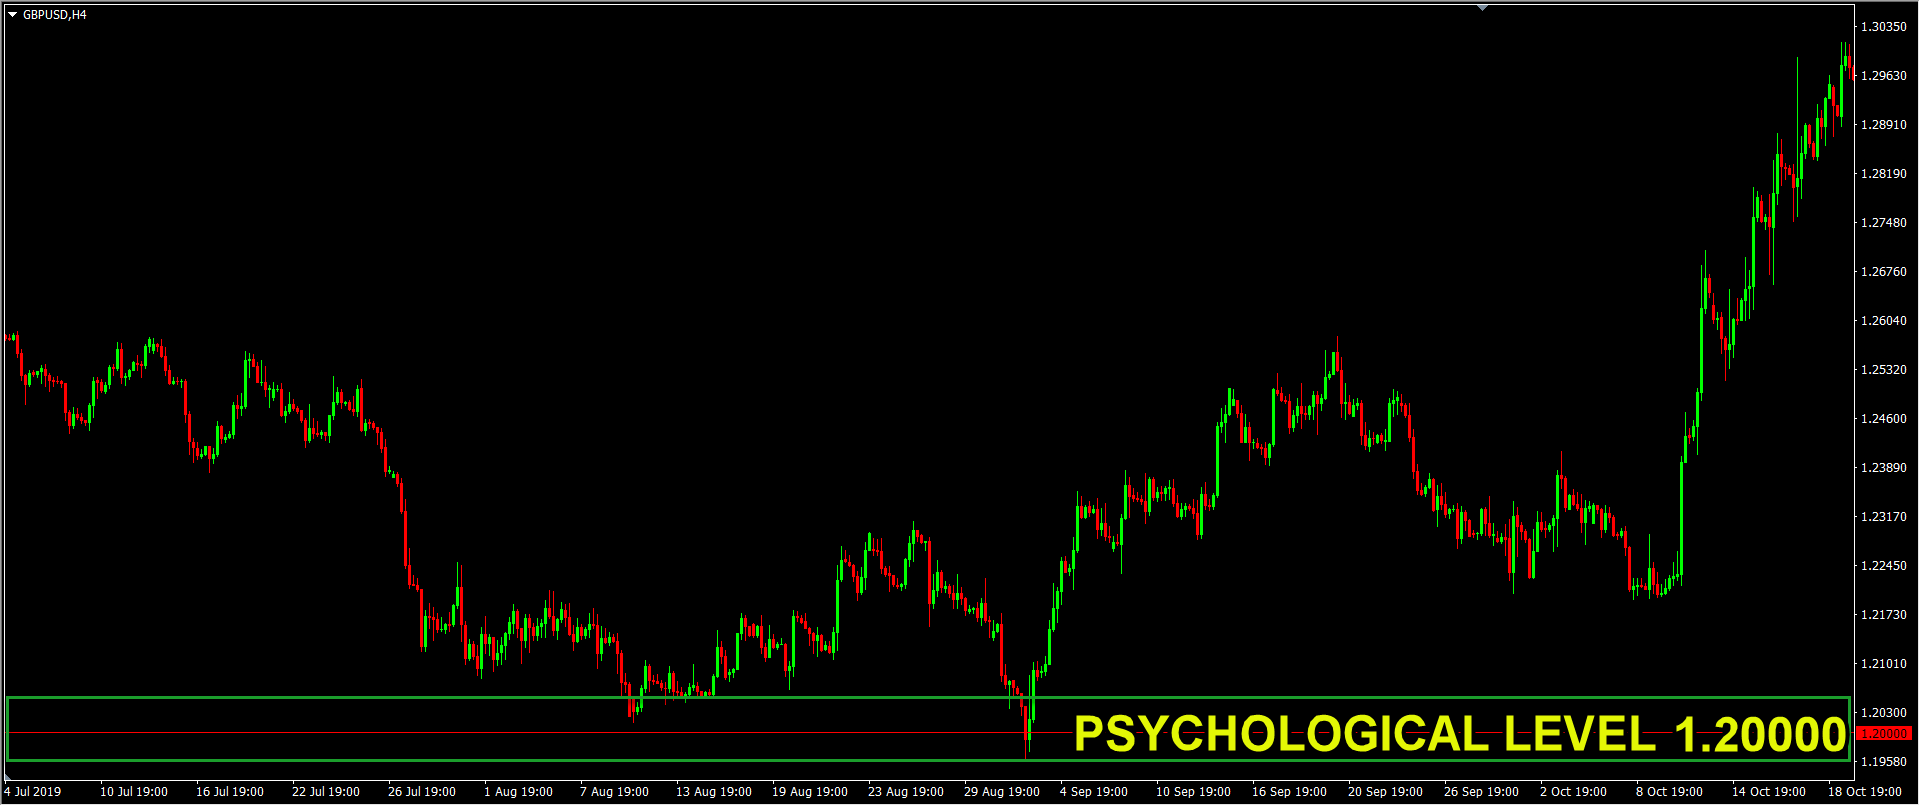
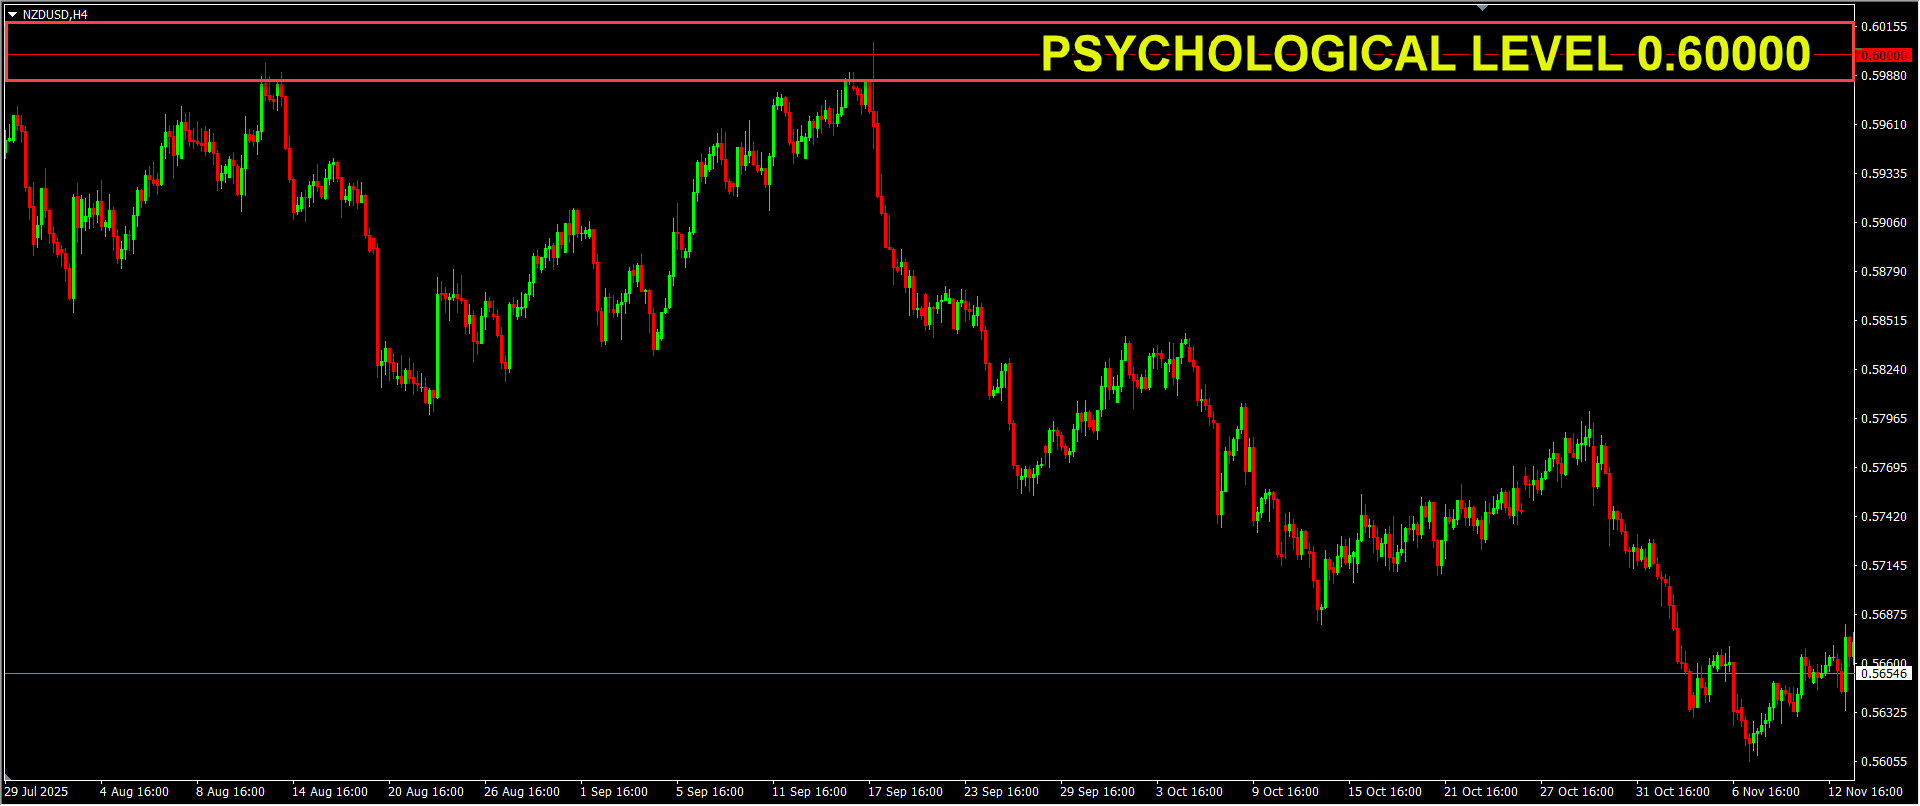
- In Forex, we must respect that other traders might see the same levels you do and many orders can be triggered at a given level or zone.
3. How to Identify Support & Resistance — Step by Step
Let’s walk you through a practical approach you can apply in your trading of, say, major currency pairs.
Step 1: Choose your Time-Frame(s)
- Start with higher time-frames (Daily or 4-hour) for your major levels.
- Then move down to lower time-frames (1-hour, 15-min) for refining entry zones.
- Why: higher time-frames give you “major highways” (stronger levels); lower ones give you “access ramps” (better entries).
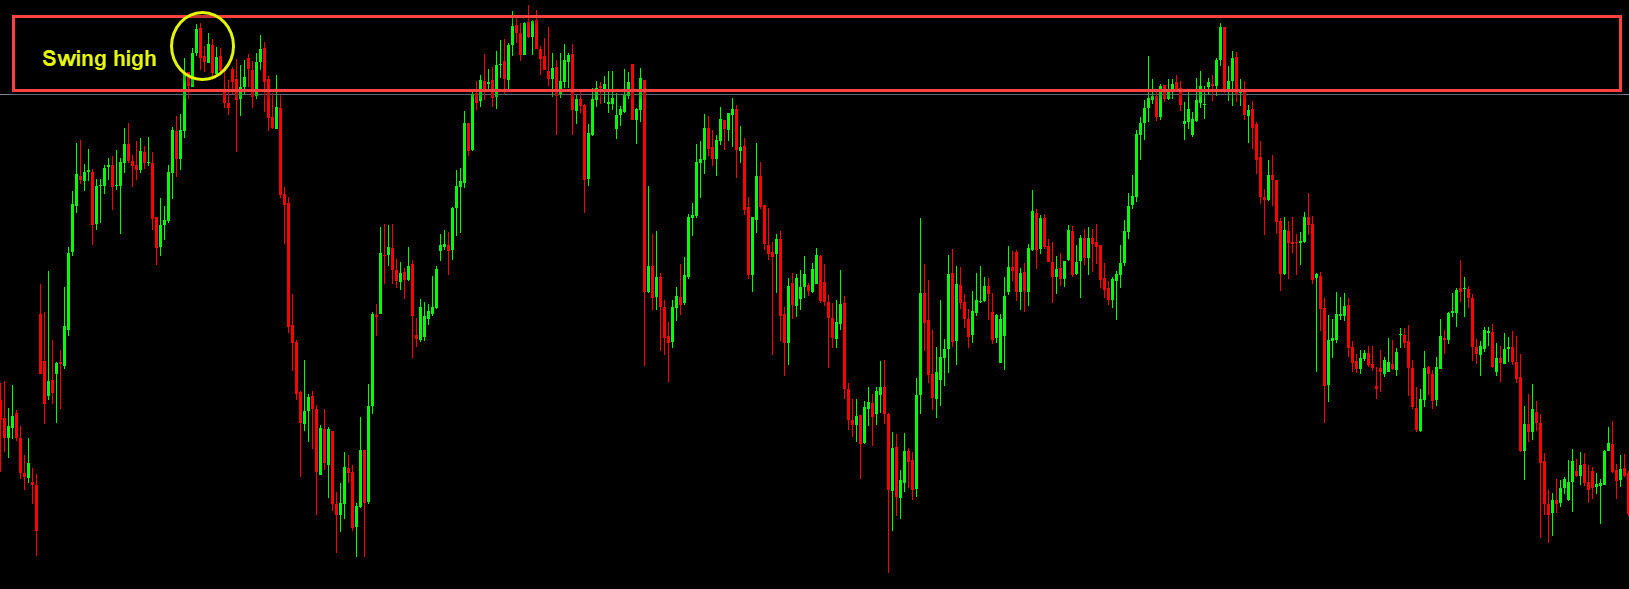
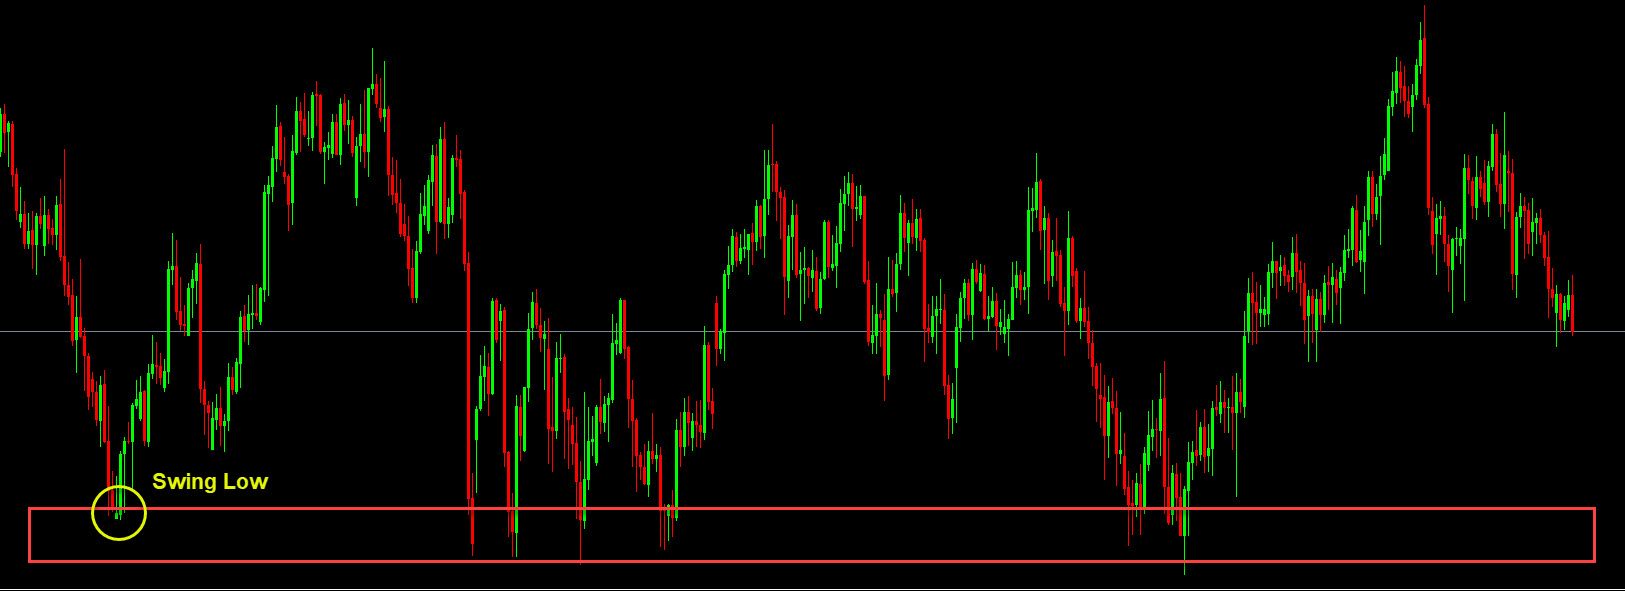
Step 2: Locate Swing Highs & Swing Lows
- On the chart, look for points where the price clearly reversed: a peak (for resistance) or a trough (for support).
Step 3: Draw Horizontal Lines or Zones
- Once you’ve found a valid swing, draw a horizontal rectangular zone around it (say ± 10-20 pips for major pairs) depending on volatility.
- Check whether the price came to test that level multiple times (remember “frequency of touches” from earlier).
Step 4: Check for Confluence
- Does your zone coincide with:
- A round number (1.2000, 1.1500)
- A major moving average (e.g., 200-period SMA)
- A trend-line or channel boundary
- A pivot point or Fibonacci retracement level (38.2%, 50%, 61.8%)
- If yes → mark this as a stronger level.
Step 5: Validate with Price Action
- When the price approaches your identified zone, observe how it reacts:
- Are the bars/candles showing slowing momentum? Wicks? Rejections?
- If there’s a bounce, that strengthens the zone.
- If there’s a clean break with strong momentum, then maybe the zone is now broken (and may flip).>
- Remember: levels aren’t perfect — they are probability structures, not guarantees.
Step 6: Use for Trade Scenarios
- Bounce trade: price drops into your support zone → you look for confirmation of bounce → consider long with stop below zone.
- Breakout trade: price rises into resistance zone → if it breaks and closes above (with momentum), you consider long (on breakout) or short if it fails.
- Always define stop-loss outside the zone (a little cushion for false breaks) and target according to your risk/reward plan.
4. Three Pitfalls to Avoid (and How to Protect Yourself)
Even the best levels can mislead you if you fall into common traps. Stay aware.
Pitfall 1 – Treating a Single Touch as a Strong Level
- If the price touched a level only once, that’s weak. You want repeat tests.
- Solution: only mark levels that show at least 2-3 meaningful touches over time.
Pitfall 2 – Ignoring the Bigger Trend or Market Context
- A support zone in a strong downtrend is more likely to break.
- Solution: Align your trade direction with the higher-time-frame trend. If the trend is down, focus more on resistance flips than on expecting support to hold.
Pitfall 3 – Drawing Too Many Levels, Overcrowding the Chart
- If you draw 40 support/resistance lines, you’ll lose the picture of what matters.
- Solution: Identify 2-3 major zones per pair per time-frame. Focus on the strongest ones.
5. Putting It All Together — Sample Workflow
Here’s a simple workflow you can add to your weekly routine:
- On Monday morning (or start of trading week): load your Daily chart for your pairs (EUR/USD, GBP/USD, USD/JPY).
- Scan for major swing highs/lows over the past few weeks, and usually not recommended more than 3-6 months. Mark 2-3 key support zones and 2-3 key resistance zones.
- Annotate the zones with notes: “tested 4 times”, “collides with 200 SMA”, “round number 1.1500”, etc…
- In your trade plan: list how price might approach each zone this week – bounce scenario, break scenario.
- Set alerts in your trading platform when price enters a zone → then switch to shorter time-frame (1H for example) for fine-tuning entry.
- Always place your stop just outside the zone and adjust your reward target based on distance to the next relevant level.
6. Why This Method Works (And Why It Won’t Always)
- Works because price levels reflect collective human behaviour: when many traders recognize the same zone, it increases the chance of a bounce or breakout.
- They also act as self-fulfilling prophecies: previous turns attract attention.
- However, markets evolve. A level can lose relevance if it’s broken or if market conditions change (volatility shifts, fundamentals).
- Also, support/resistance are not hair-fine lines; they are zones of probability. Don’t treat them like guarantees.
7. Final Thoughts
If you want to improve your trading, mastering support & resistance is
essential. It provides a foundation on which you can build more advanced filters (price action, momentum, order flow).
Make support/resistance your first step — identify the terrain, then plan how you will navigate it. Combine that with the analysis you already do (technical set-ups, fundamentals, etc.). Over time, you’ll start recognizing
zones that matter vs those that don’t.
And one friendly reminder: always keep risk under control. A strong support doesn’t always hold, a strong resistance doesn’t always reverse. Manage your stop-loss, stick to your plan, and keep your mind clear.