Identifying Trends
Trading in the Forex market can sometimes feel like trying to surf on a giant, ever-moving ocean. The waves rise, fall, and sometimes just flatten out. The key to making sense of it all — and riding those waves successfully — is learning to identify the trend. In other words: are prices generally going up, going down, or is the market just choppy and sideways? Once you can spot a trend reliably, you’ll have a huge advantage. In this article, we walk you through exactly how to identify trends in Forex — in simple language, step by step, and in a friendly style.
What is a “Trend” in Forex
- A trend is the overall direction in which a currency pair’s price is moving over time. In Forex, a trend can be up (bullish), down (bearish), or sideways (range-bound / no clear direction).
- Trading with a trend — rather than against it — is often safer because you are essentially “going with the flow” of the market.
- The trading method that leans on this idea is known as trend-following. Traders using trend-following don’t try to forecast exact highs or lows. Instead, they try to “hop on the wave” of the trend and ride until signs suggest it’s ending.
Why Trend Identification Matters
-
Aligning with Market Momentum By identifying a trend, you avoid trading against the prevailing direction — which reduces your risk of being “fighting the current.”
-
Smoother Decision Making Instead of guessing where price will go, you follow what price is already doing. This helps reduce confusion and impulsive trades.
-
Better Trade Entries and Exits If you know the trend, you can choose entries that maximize your chances (buying in an uptrend, selling in a downtrend) — and set exits wisely when the trend shows signs of reversing.
Simple Visual Method — Price Structure: Higher Highs / Higher Lows
One of the most basic and powerful ways to see a trend is by looking at how price moves, without relying on fancy indicators.
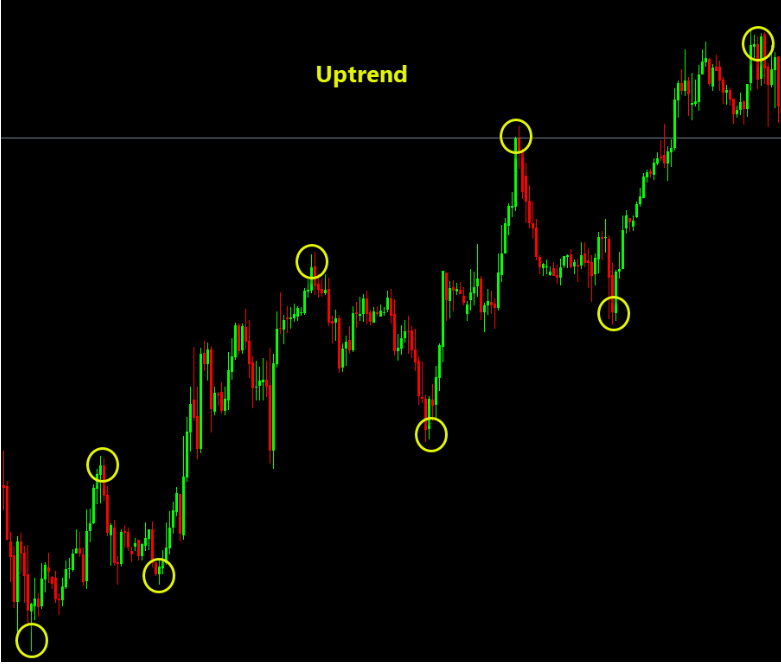
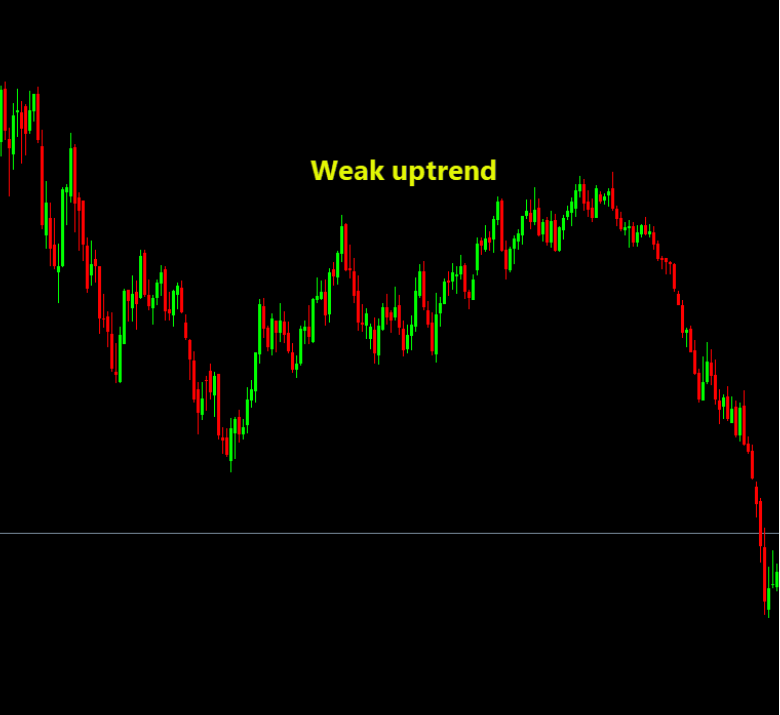
- Uptrend (bullish): The chart shows higher highs and higher lows. This means every time price dips, it doesn’t dip as low as before — and every rally reaches a higher high than before.
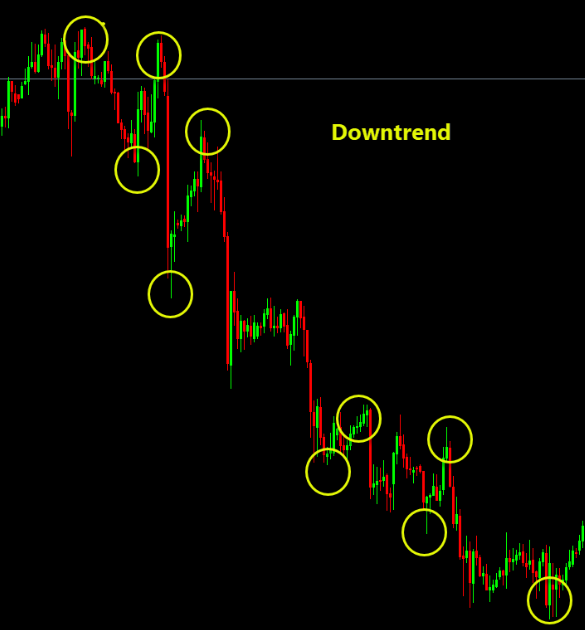
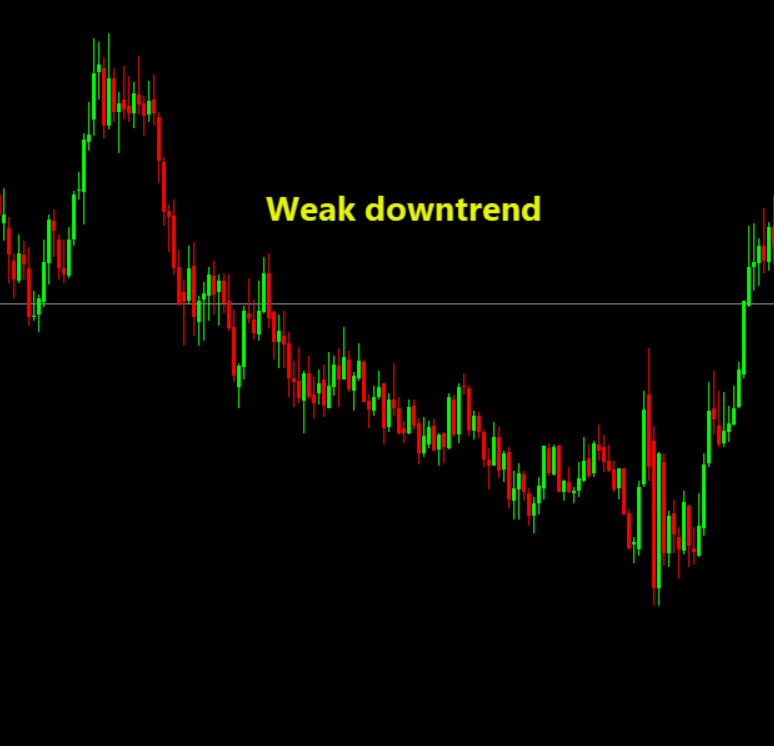
- Downtrend (bearish): The opposite — lower lows and lower highs. Price rebounds, but it fails to go as high as before; dips go lower than before.
- Sideways / Range (no trend): Price keeps oscillating between roughly the same highs and lows; no clear progress up or down. That means neither buyers nor sellers have firm control.
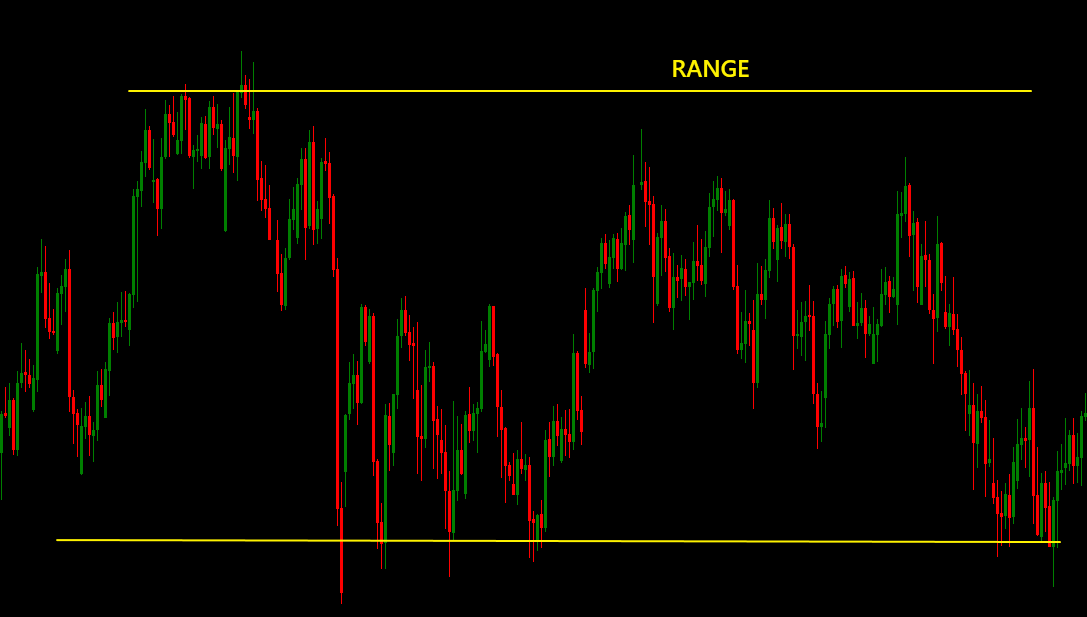
Think of it like walking: if you see each step going up the stairs (higher high/lows), that’s an uptrend; if you see steps going down the stairs, that’s a downtrend; if you’re just walking on flat ground, that’s sideways.
Drawing Trendlines and Channels — A Classic Chart Trick
To make the market’s path easier to see, traders often draw trendlines directly on the chart.
-
For an uptrend, draw a line connecting the lows (the bottoms) of successive dips; each dip should be higher than the previous. That becomes your rising trendline.
-
For a downtrend, draw a line connecting successive highs (the peaks); each peak should be lower than the previous. That gives you a descending trendline.
-
For a trendline to be more reliable, you ideally want at least 2–3 “touches” — points where price approaches the line and respects it (bounces or reacts). The more touches, the more traders are confirming that line as support or resistance.
-
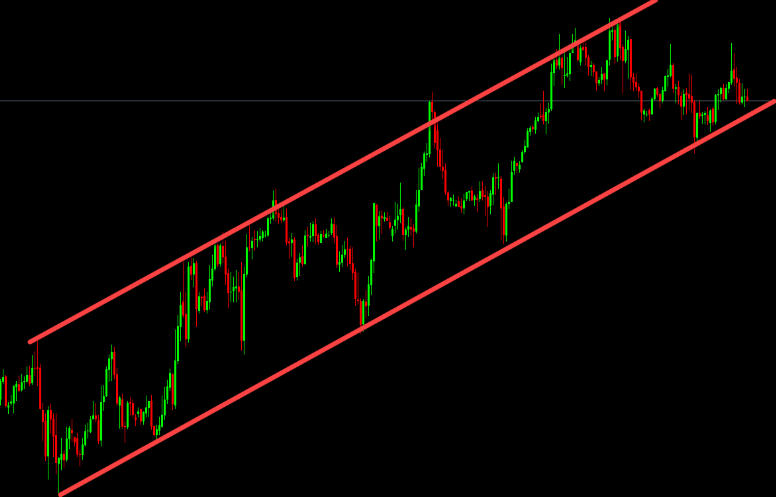
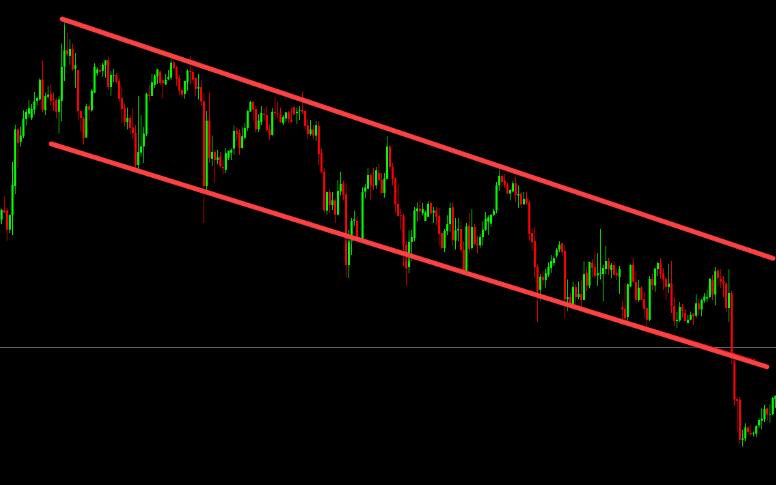
Sometimes, traders draw channels — two parallel trendlines that contain price movement (upper line from highs, lower line from lows). Channels help visualize the “corridor” in which price moves during a trend.
Trendlines and channels act like a simple guide on the chart — they show you where price has reacted before, and help you spot areas where the market might slow down, turn around, or push through with strength.
Technical Indicators — Tools to Confirm the Trend
Relying solely on price action is powerful — but combining it with technical indicators often improves reliability. Here are some widely used ones:
✅ Moving Averages (MA)
-
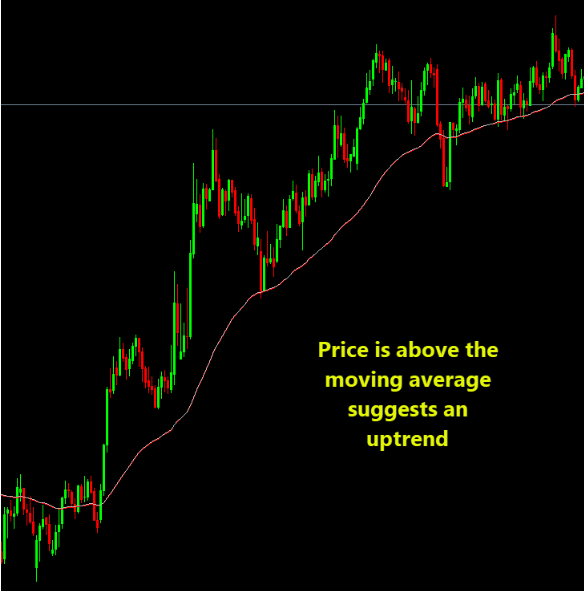
A moving average smooths out the price data over a set period (e.g., 50 days, 200 days) so you see the “average” direction, not every tiny wiggle.
-
If price stays above the moving average, it suggests an uptrend. If price remains below, it suggests a downtrend.

-
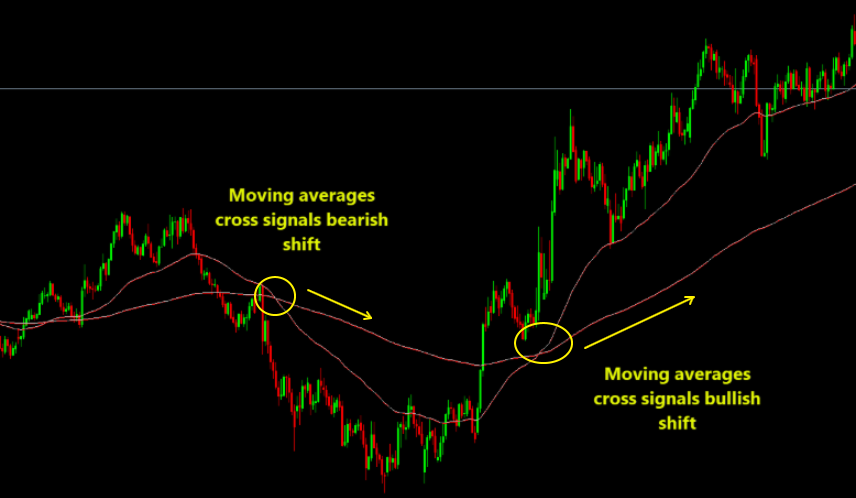
Many traders use two MAs together: a shorter-term and a longer-term. When the short-term MA crosses above the long-term MA, it can signal a trend beginning/continuation (bullish) and a potential buy opportunity.. When it crosses below, it can signal a bearish shift and a potential sell opportunity. This is called a moving-average crossover strategy.
-
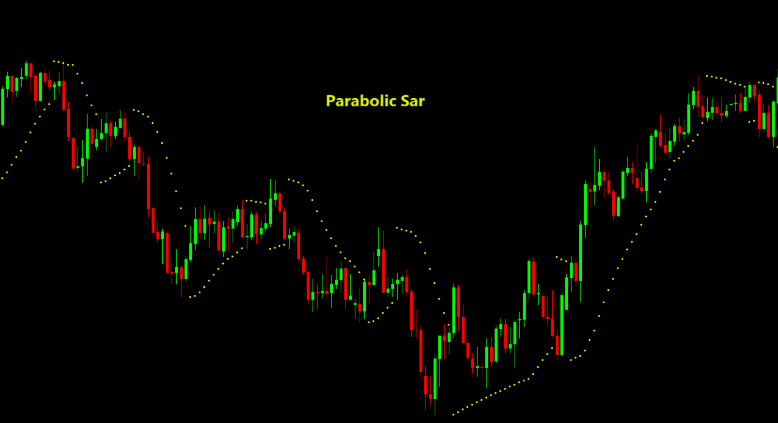
Parabolic SAR can help with trailing stop-loss or timing exits during a trend. But many experts warn — it works best during a clear trend, and gives false signals (whipsaws) during sideways or choppy markets.
Trend Strength — How Strong Is the Trend?
Not all trends are equal. Some are calm and gradual, others are powerful with steep momentum. Knowing trend strength can help you choose whether it’s worth entering, or whether the trend is likely to end soon.
- Watch momentum: if every rally (in an uptrend) is strong and dips are shallow, that’s a sign of healthy bullish strength. If rallies grow weaker and dips become deeper, trend might be weakening.
- Use confirmation tools — e.g., moving averages, MACD, or even volume (if available), or price action patterns — to check whether direction has backing.
- Recognize that trends aren’t straight lines — they zig-zag, pause, retrace, and consolidate. Sometimes the price will move sideways (range) for a while before resuming the trend or reversing.
Patience and discipline matter a lot here — waiting for confirmation rather than jumping in too early often saves a trader from false moves.
Common Pitfalls — What to Watch Out For
Just as important as knowing how to spot trends is knowing when not to trust them blindly. Here are some common mistakes:
- Over-reliance on a single tool. Using only moving averages, or only trendlines, can mislead you — especially in volatile or sideways markets. Mix multiple tools for better confirmation and combine them with the price structure.
- Ignoring price structure. Some traders get lost in indicators and forget to check higher highs/lows and lower highs/lows. Price action gives clues that indicators might miss. Remember – Indicators indicate, the price dictates!
- Chasing after weak trends. Not all trends are worth trading. Weak, shallow, or choppy trends may not provide enough profit — and can easily reverse.
- Poor risk management / trade size focus over market structure. Trend following isn’t only about catching the wave — it’s about staying safe. Over-leveraging or trading too big can wipe you out if the trend suddenly reverses.
A Simple “Trend Identification Checklist” You Can Use
Imagine you open a chart of a currency pair. Ask yourself the following:
- What’s the broader direction? Are prices generally rising, falling, or moving sideways?
- Is the price structure clean? (Higher highs & higher lows for uptrend; or lower highs & lower lows for downtrend.)
- Can I draw a trendline or channel that holds? Are there at least 2–3 reaction points (touches)?
- What do moving averages say? Is the price above/below the MA (moving average)? If using two MAs, is there a crossover?
- Do confirmation indicators agree? (e.g. MACD, Parabolic SAR, or other tools you trust.)
- Does the trend look strong (momentum, clear swings), or weak/choppy? Is it worth entering a trade, and if so, what will be your risk controls (stop-loss, trade size, target)?
If most answers are positive, you likely have a real trend worth riding. If not, it may be best to wait.
Final Thoughts — Think Like a Trend-Follower, Not a Nostradamus
Identifying Forex trends isn’t about predicting where exactly the price will go. Thinking you can know the next top or bottom is a recipe for disappointment. Instead, treat the market like a flowing river: watch how the water moves, notice if it’s rising or falling, see if there are obstacles (resistance/support), and ride the flow until it loses momentum.
Trend-following is humble: you don’t need to “get it right” all the time, you just need to follow what’s happening, be patient, respect risk, and let the market do its thing.
Over time, with practice, reading charts, land earning from mistakes, you’ll start to feel the trend — not just see it. And that, in many ways, is the heart of smart Forex trading.