When you begin trading Forex, one of the first sets of technical analysis tools/indicators you’ll meet are
Moving Averages . They often look simple — just lines on a chart — but their effectiveness lies in how you interpret and apply them.
In this article, we’ll break down the two most commonly used moving averages:
- Simple Moving Average (SMA)
- Exponential Moving Average (EMA)
You’ll learn why they work, how they differ, and how to use them in your trading like a professional, without confusion or jargon.
📌 What Are Moving Averages?
At the core, a
Moving Average (MA) is a tool that:
✔ Smooths price data
✔ Shows direction of price movement
✔ Helps identify/confirm trends
✔ Reduces “noise” — random price ups and downs
Imagine the price on a chart as a jagged mountain range. A moving average is like a smooth trail running through it — helping you see the direction the market is heading.
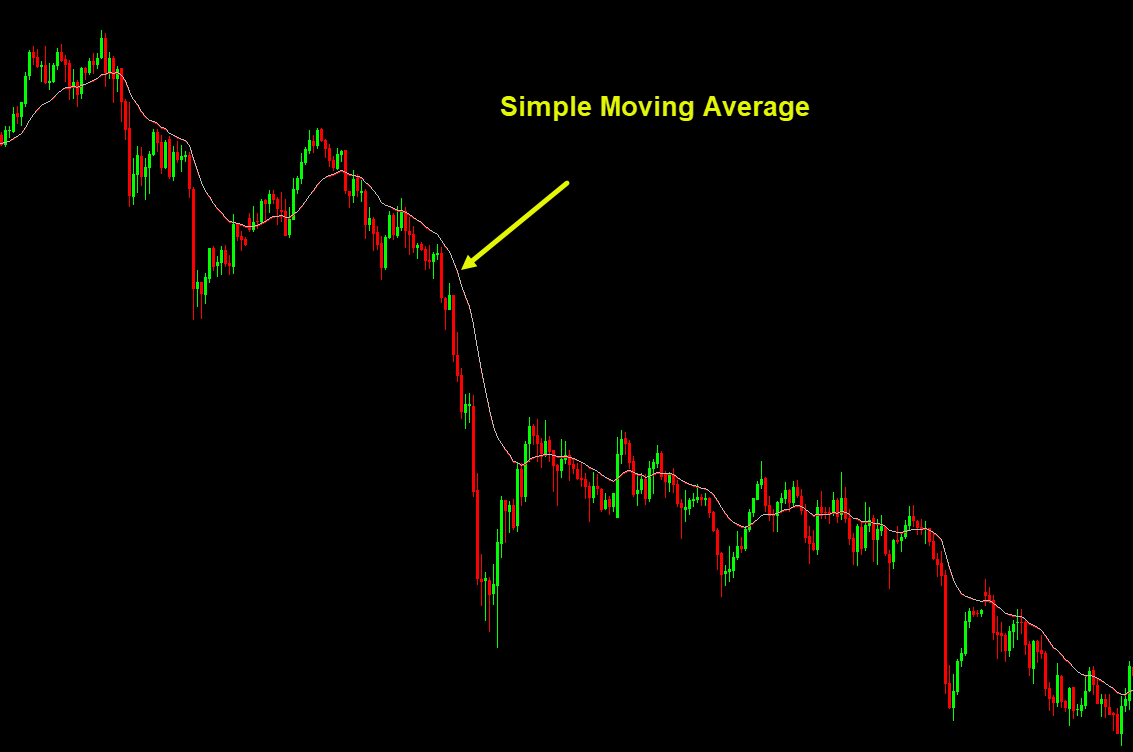
🟡 Simple Moving Average (SMA)
🧠 What Is SMA?
The
Simple Moving Average takes a specific number of price data points (for example, closing prices) and calculates their average.
 Example:
 A 20-period SMA adds the last 20 closing prices and divides by 20.
📍 So, SMA = Average of the last X prices.
It smooths the price evenly over time — each price in the calculation gets equal weight.
✔ Why Traders Use SMA
✅ Shows the general trend
✅ Easy to calculate and visualize
✅ Useful in range markets
✅ Great for support/resistance areas
🚦 SMA Signals Explained
Here is how traders commonly use SMAs:
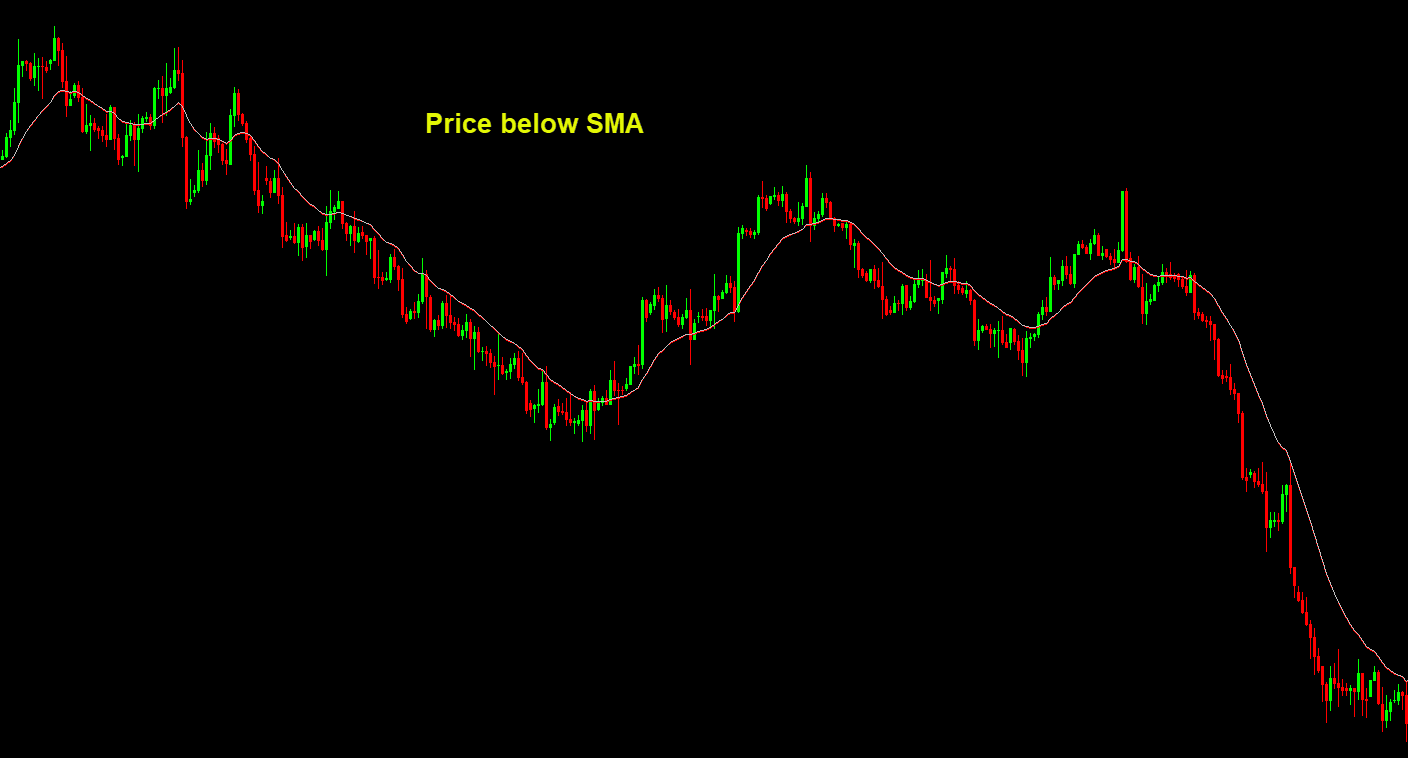
➤ Trend Identification
- Price above SMA ➝ Bullish trend
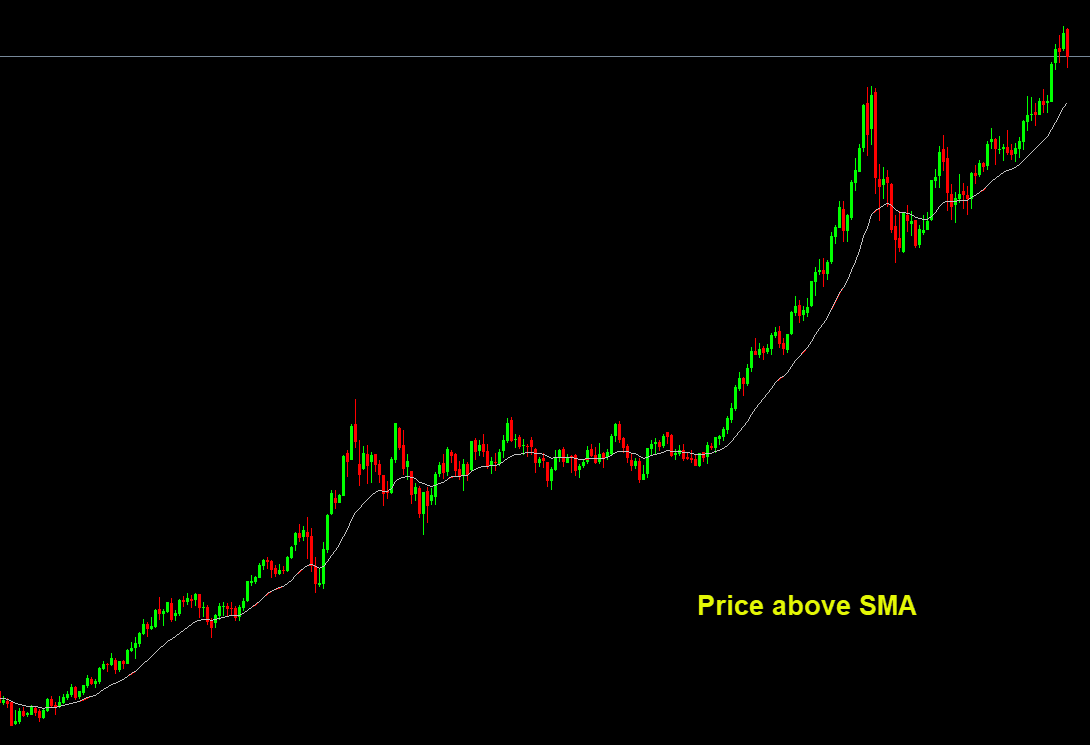
- Price below SMA ➝ Bearish trend
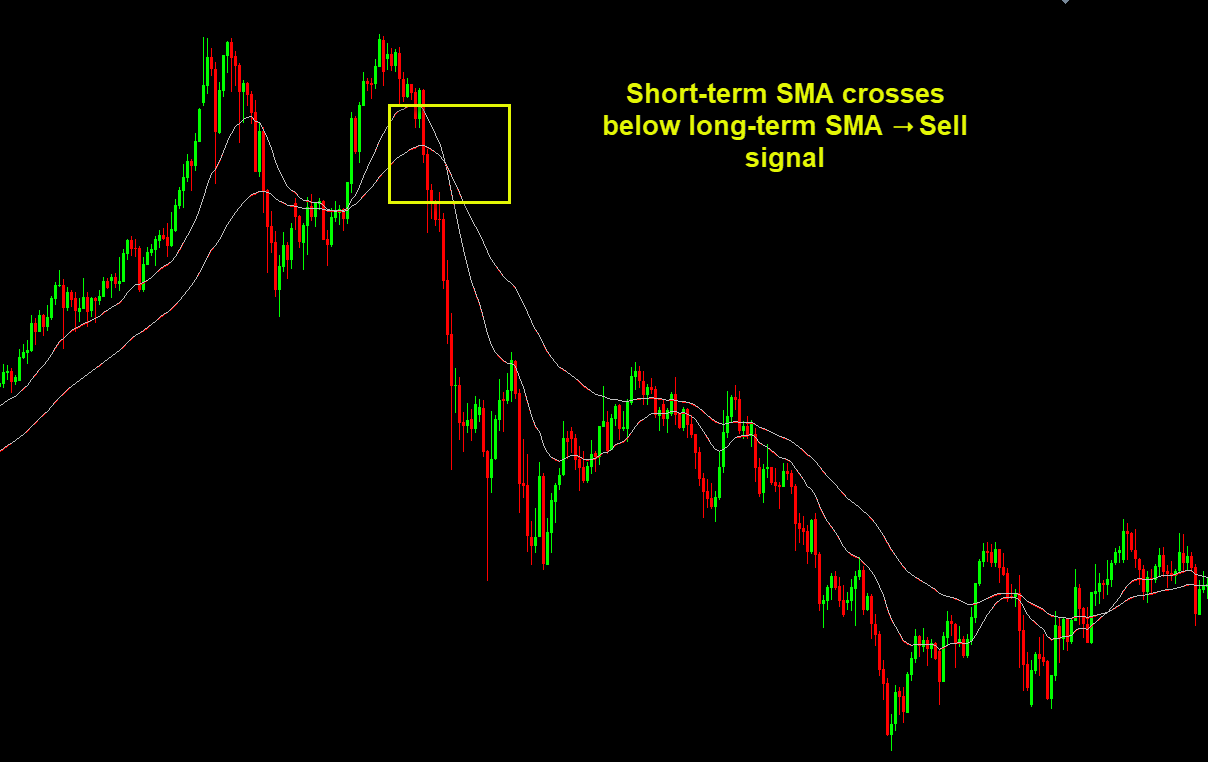
➤ Crossovers (a classic technique)
- Short-term SMA (for example, 20) crosses above long-term SMA (for example, 50) ➝ Buy signal
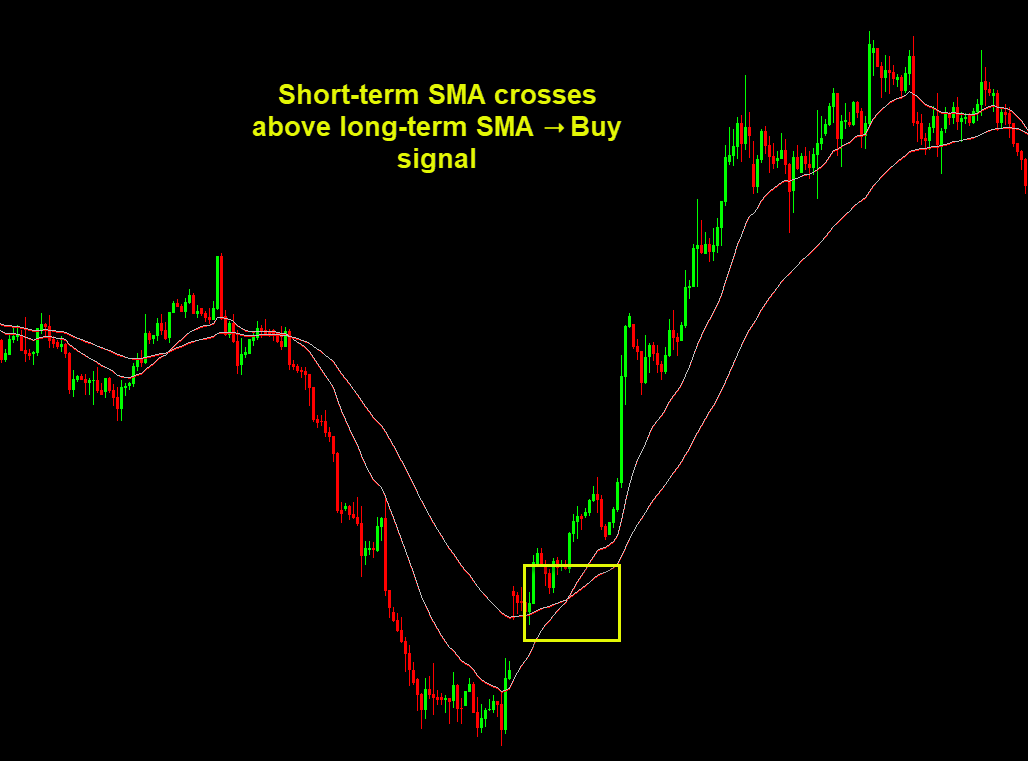
- Short-term SMA (for example, 20) crosses below long-term SMA (for example, 50) ➝ Sell signal
Example commonly used:
20 SMA and 50 SMA, and for broader ranges, 50 SMA and
200 SMA
| Crossover |
Interpretation |
| 50 SMA above 200 SMA |
Bullish (trend up) |
| 50 SMA below 200 SMA |
Bearish (trend down) |
🔵 Exponential Moving Average (EMA)
🧠 What Is EMA?
The
Exponential Moving Average is similar to SMA — but with a twist:
✔ It gives more weight to the
latest prices
✔ It reacts faster to recent price changes
This makes EMA more responsive — especially helpful in fast, volatile markets like Forex.
In simple terms:
👉 Recent price action has more influence on EMA than older data.
👍 Why Traders Choose EMA
✅ Faster reaction to price changes
✅ Better for short-term trading
✅ More responsive in trending markets
✅ Preferred by many professional traders
📌 EMA Signals You Should Know
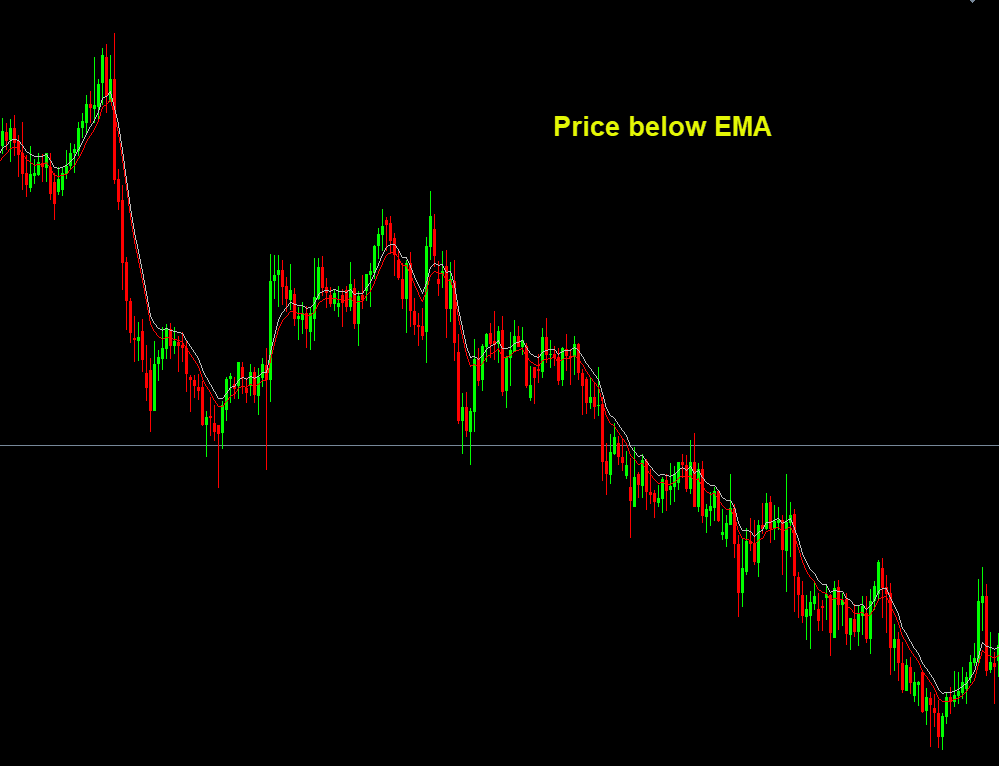
➤ Trend Confirmation
- Price above EMA → Trend is up
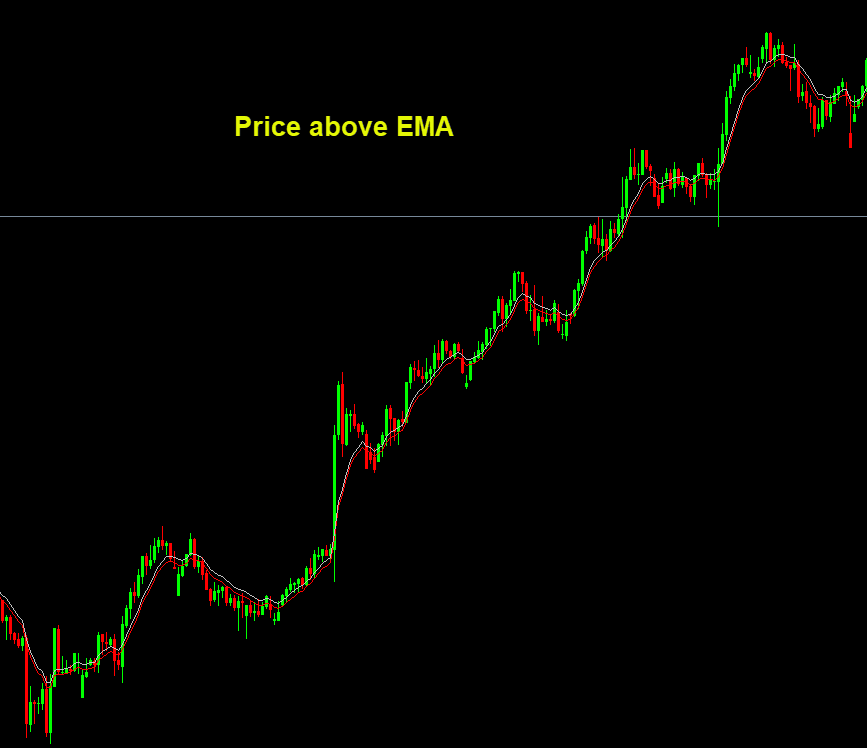
- Price below EMA → Trend is down
Popular EMA setups:
- 9 EMA
- 21 EMA
- 50 EMA
- 100 EMA
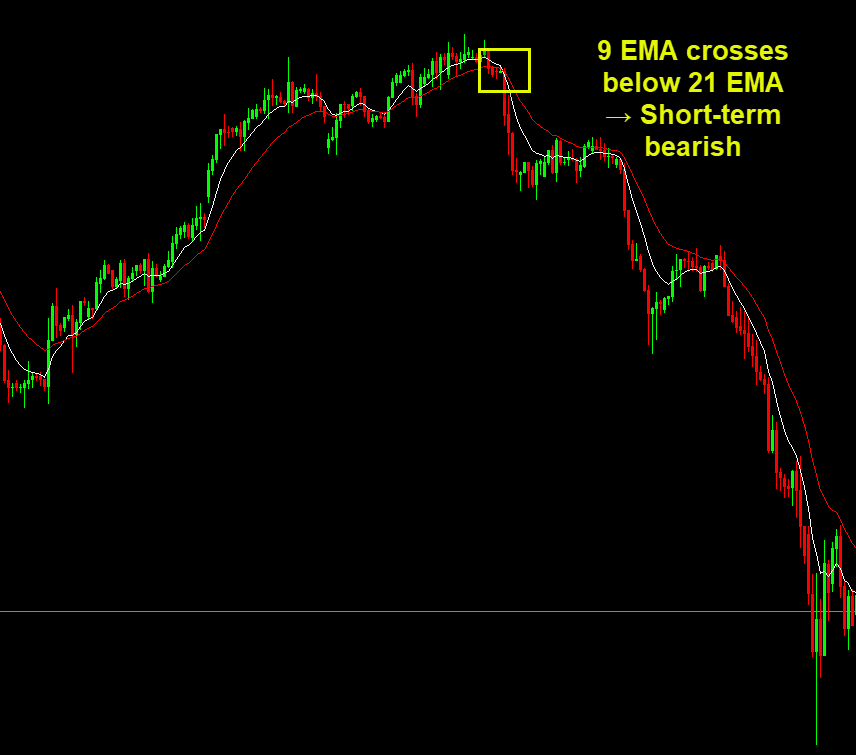
➤ EMA Crossovers
Much like SMA, but faster:
- 9 EMA crosses above 21 EMA → Short-term bullish
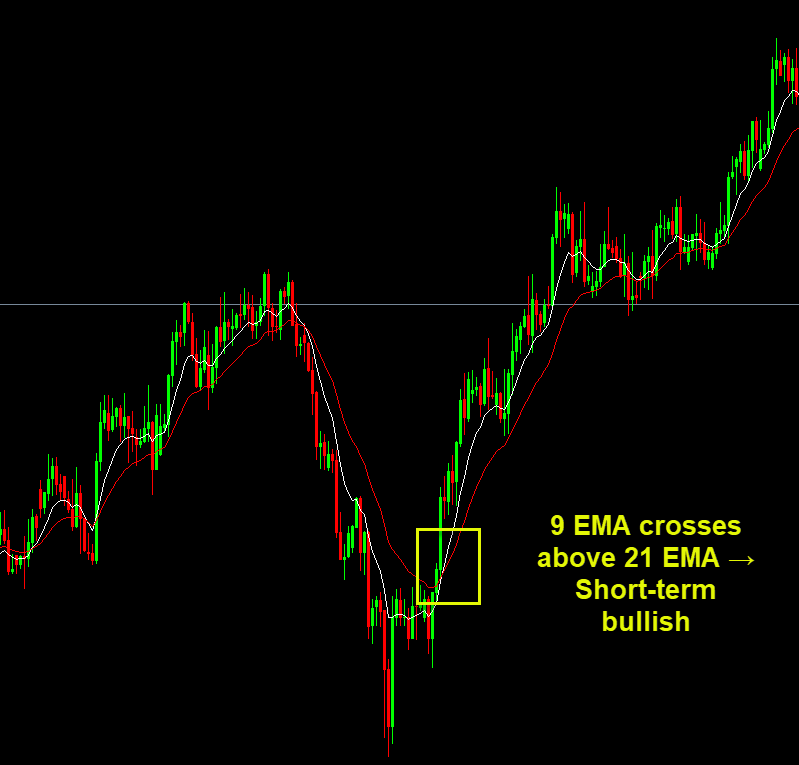
- 9 EMA crosses below 21 EMA → Short-term bearish
🎯 SMA vs EMA — What’s the Difference?
Let’s break down the key differences in simple terms:
| Feature |
SMA |
EMA |
| Reaction to price |
Slower |
Faster |
| Weighting |
Equal |
Recent prices weighted more |
| Best for |
Longer-term trends |
Short/medium-term trends |
| Noise sensitivity |
Less |
More (but more responsive) |
In short:
- SMA = Stable
- EMA = Responsive
Both are useful — you just need to know when to use each.
🧠 Real-World Application: How Traders Use MAs in Forex
🪜 1. Identify the Trend
Before entering a trade, ask:
✔ Is the price above or below the moving average?
✔ Are the moving averages sloping up or down?
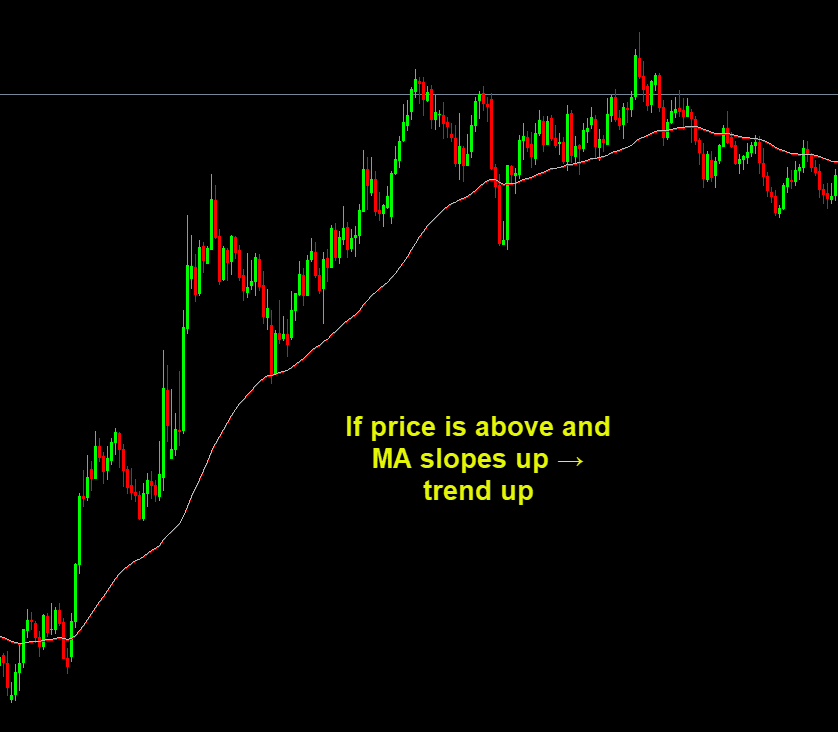
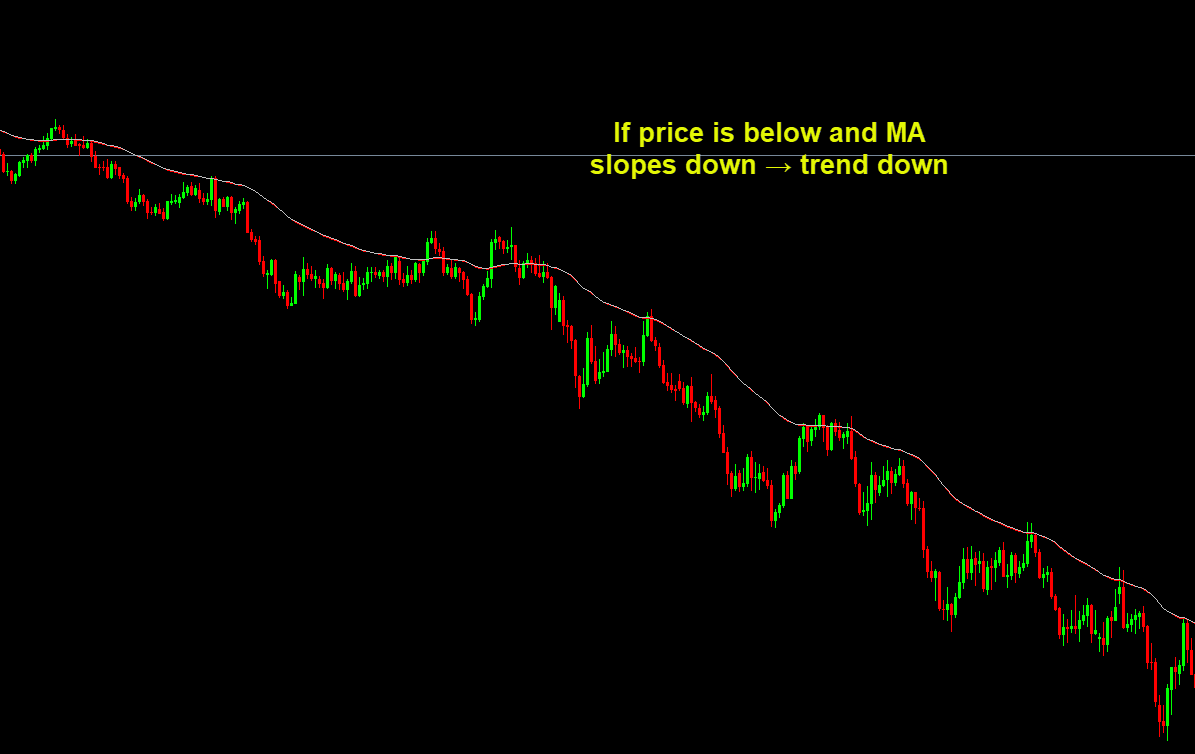
If price is above and MA slopes up → trend up If price is below and MA slopes down → trend down
🧠 2. Confirm With Crossovers
Crossovers give you an early indication of trend changes:
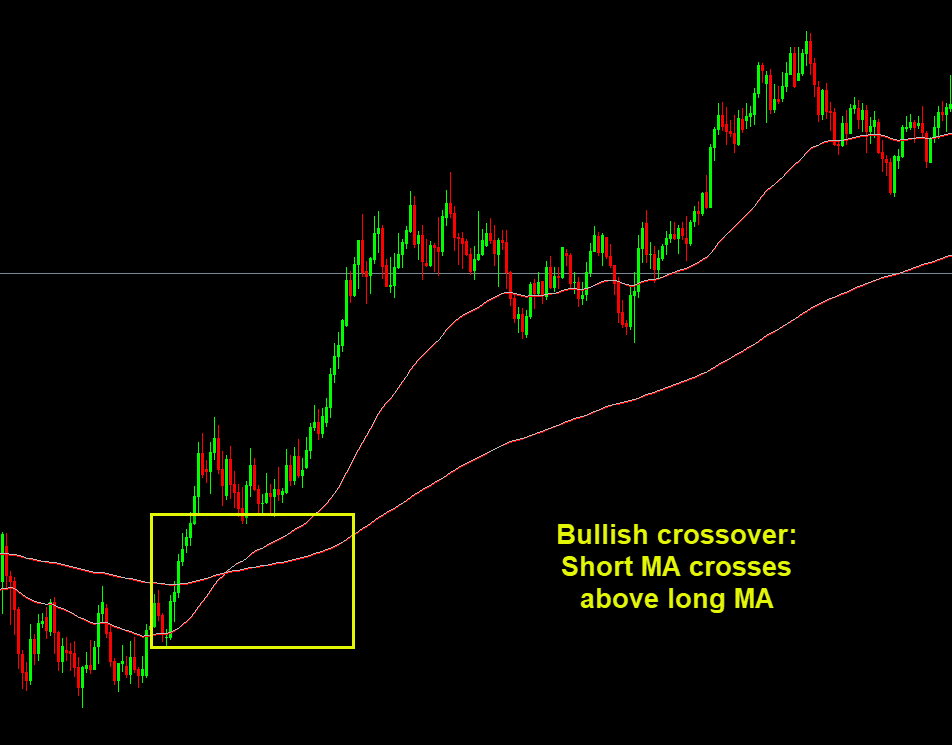

📈
Bullish crossover: Short MA crosses above long MA (as explained above, for example 20 and 50, or 50 and 200) 📉
Bearish crossover: Short MA crosses below long MA
This helps reduce premature entries in choppy markets.
🛑 3. Support & Resistance
Moving averages can act as:
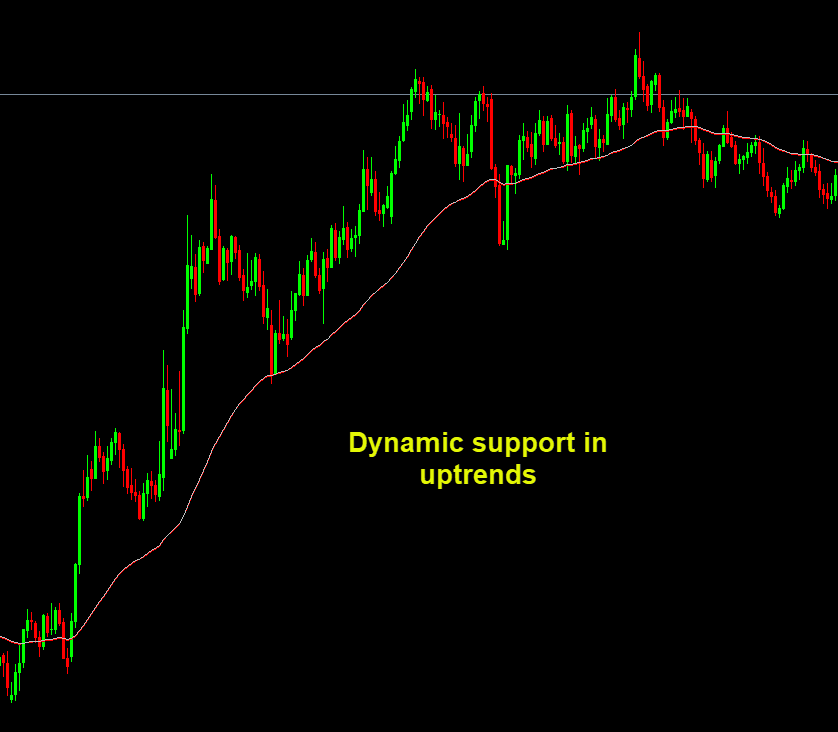
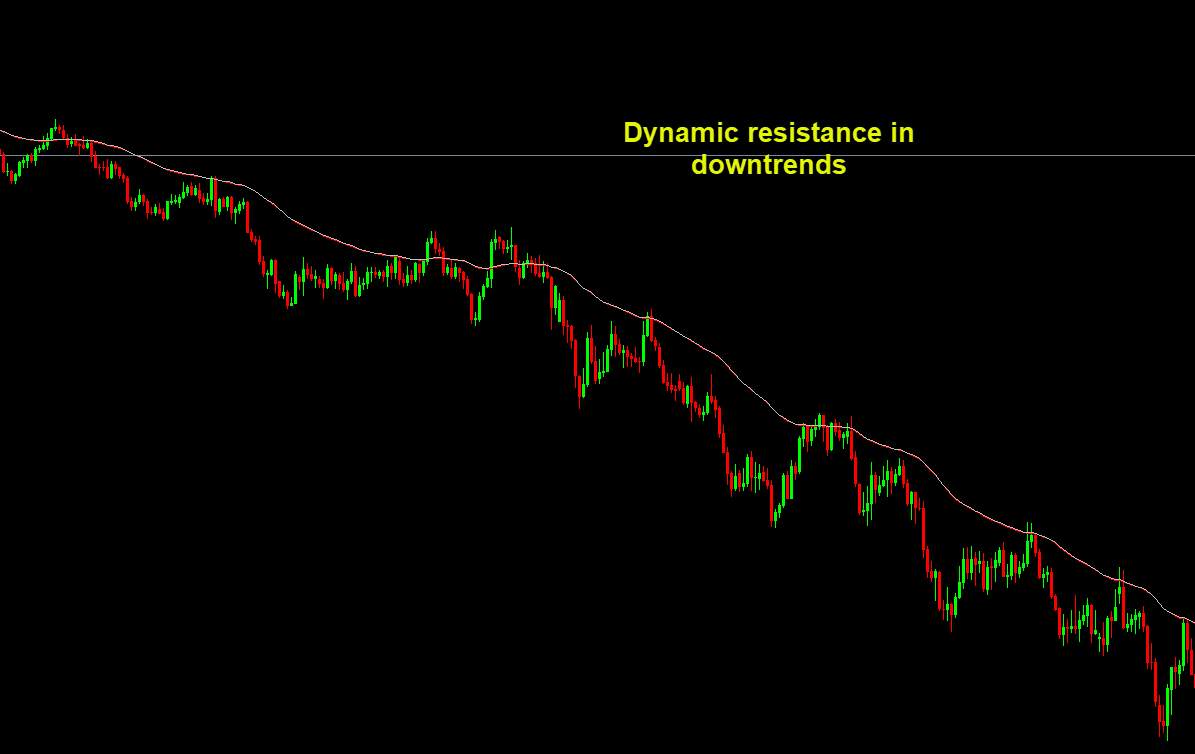
✔ Dynamic support in uptrends, and can provide additional entries or re-entries to the developing trend ✔ Dynamic resistance in downtrends, and can provide additional entries or re-entries to the developing trend
Traders often look for price pullbacks toward the MA, then continuation.
⚠ Common Pitfalls & How to Avoid Them
Even though MAs are powerful, they aren’t flawless.
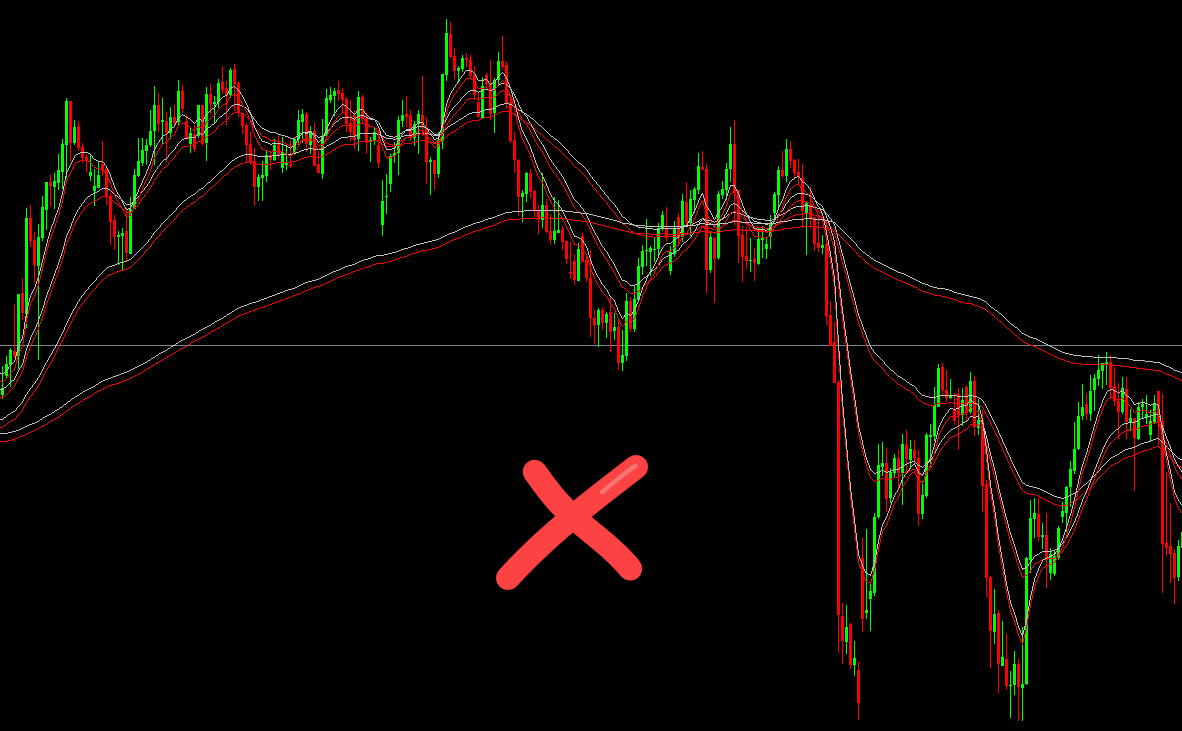
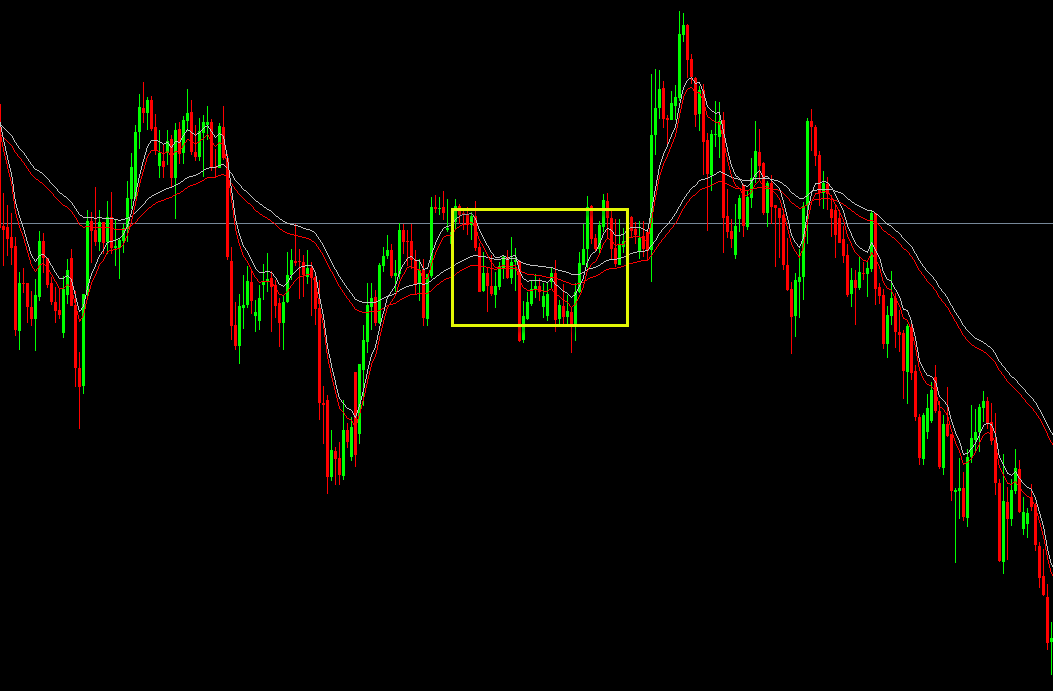
❗ Pitfall 1: Using MAs in a Sideways Market
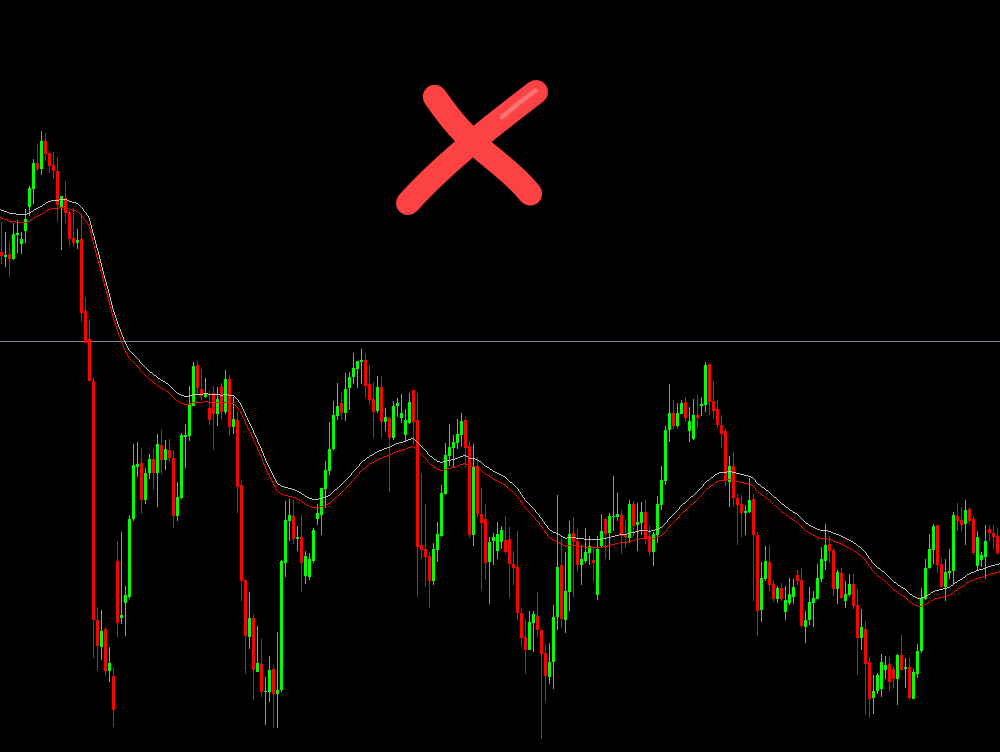
In range markets, moving averages can give false signals.
Solution: Combine with other tools for additional confirmation.
❗ Pitfall 2: Too Many Moving Averages
More lines ≠ better signals. Using 3–4 MAs can clutter your chart and confuse signals.
Solution: Stick with 1–2 MAs per time frame.
❗ Pitfall 3: Blind Entry on Crossovers
Not all crossovers are valid!
 Solution:
 Always confirm with trend direction and price action.
✔ Takeaway: How to Make Moving Averages Work for You
Moving Averages are not magic — but they are practical trend tools when used correctly:
🔹 SMA = longer-term clarity
🔹 EMA = faster response
🔹 Always confirm with other factors
🔹 Use them to measure trend and pullbacks
In Forex, trend is your friend — and moving averages help you follow it with confidence.
🧠 Pro Tip for Forex Traders
If you’re trading daily timeframes:
👉 Use
50 SMA +
200 SMA to define the major trend 👉 Use
9 EMA +
21 EMA for entry timing in short to medium swings
This approach lets you align your entries with the prevailing trend — reducing fakeouts and improving trade quality.