If there’s one concept in Forex that separates tentative traders from confident ones, it’s this:
👉 Understanding how different timeframes “speak” to each other — and using that alignment to make better decisions.
 Many traders struggle because they look at price movements in isolation — just one chart, one timeframe, one perspective. But the market isn’t one-dimensional. It moves in layers, and each timeframe tells a piece of the story.
In this article, we’ll explore:
✔ What a multi-timeframe strategy actually means ✔ Why alignment matters ✔ How to build a workflow that simplifies your decisions ✔ Common mistakes traders make ✔ A step-by-step action plan you can use immediately
Let’s break it down in simple, friendly language — no fluff, no confusion, just clarity. 🚀
Many traders struggle because they look at price movements in isolation — just one chart, one timeframe, one perspective. But the market isn’t one-dimensional. It moves in layers, and each timeframe tells a piece of the story.
In this article, we’ll explore:
✔ What a multi-timeframe strategy actually means ✔ Why alignment matters ✔ How to build a workflow that simplifies your decisions ✔ Common mistakes traders make ✔ A step-by-step action plan you can use immediately
Let’s break it down in simple, friendly language — no fluff, no confusion, just clarity. 🚀
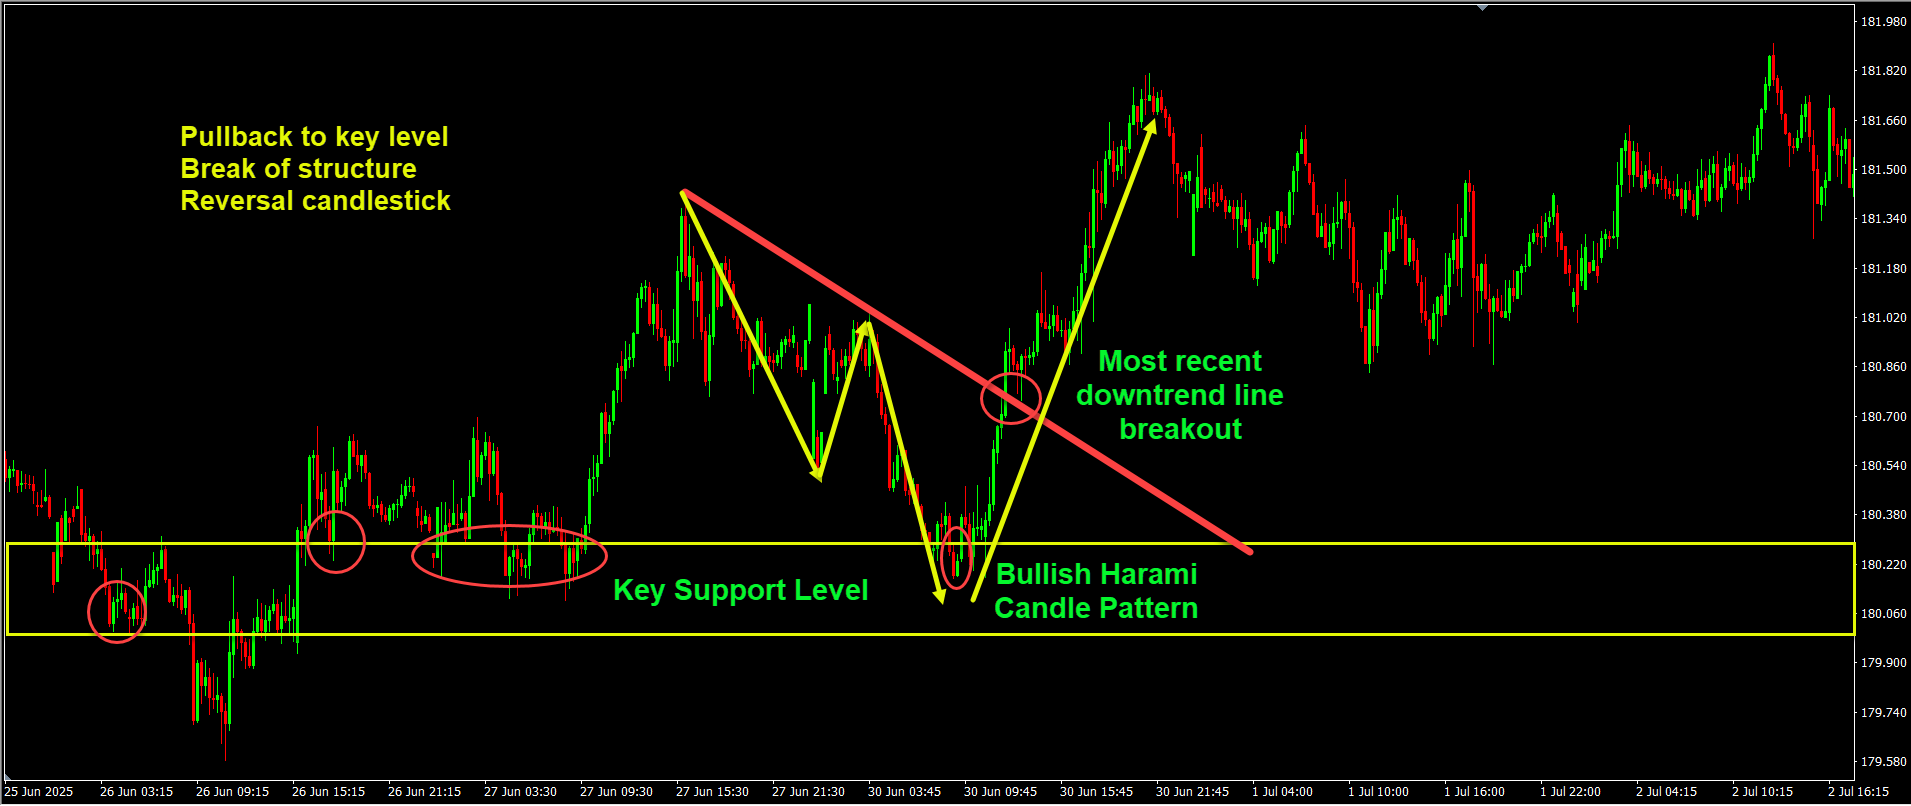
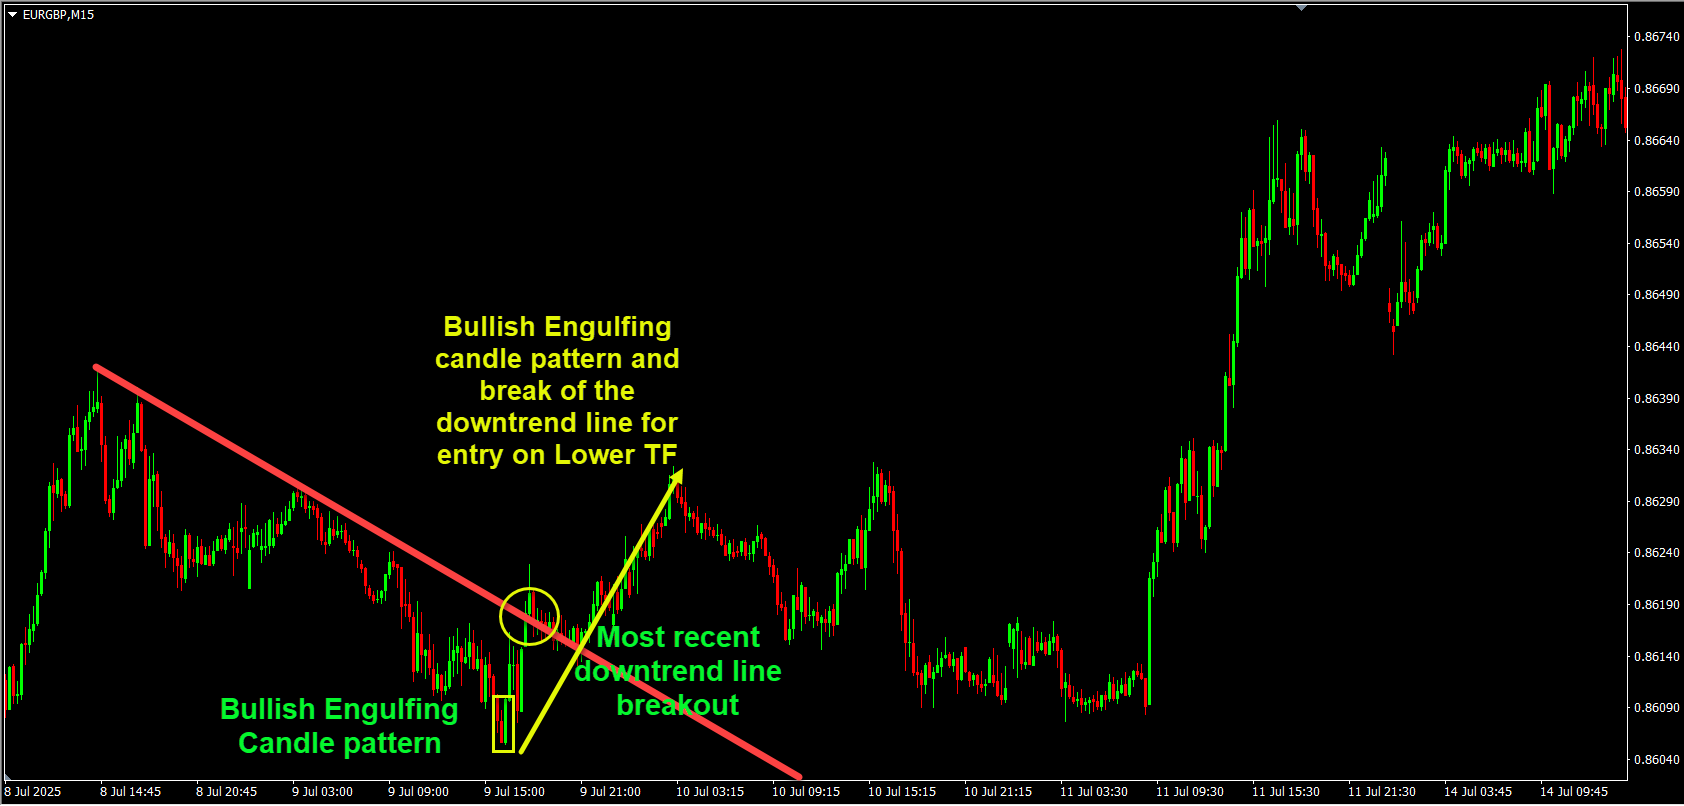
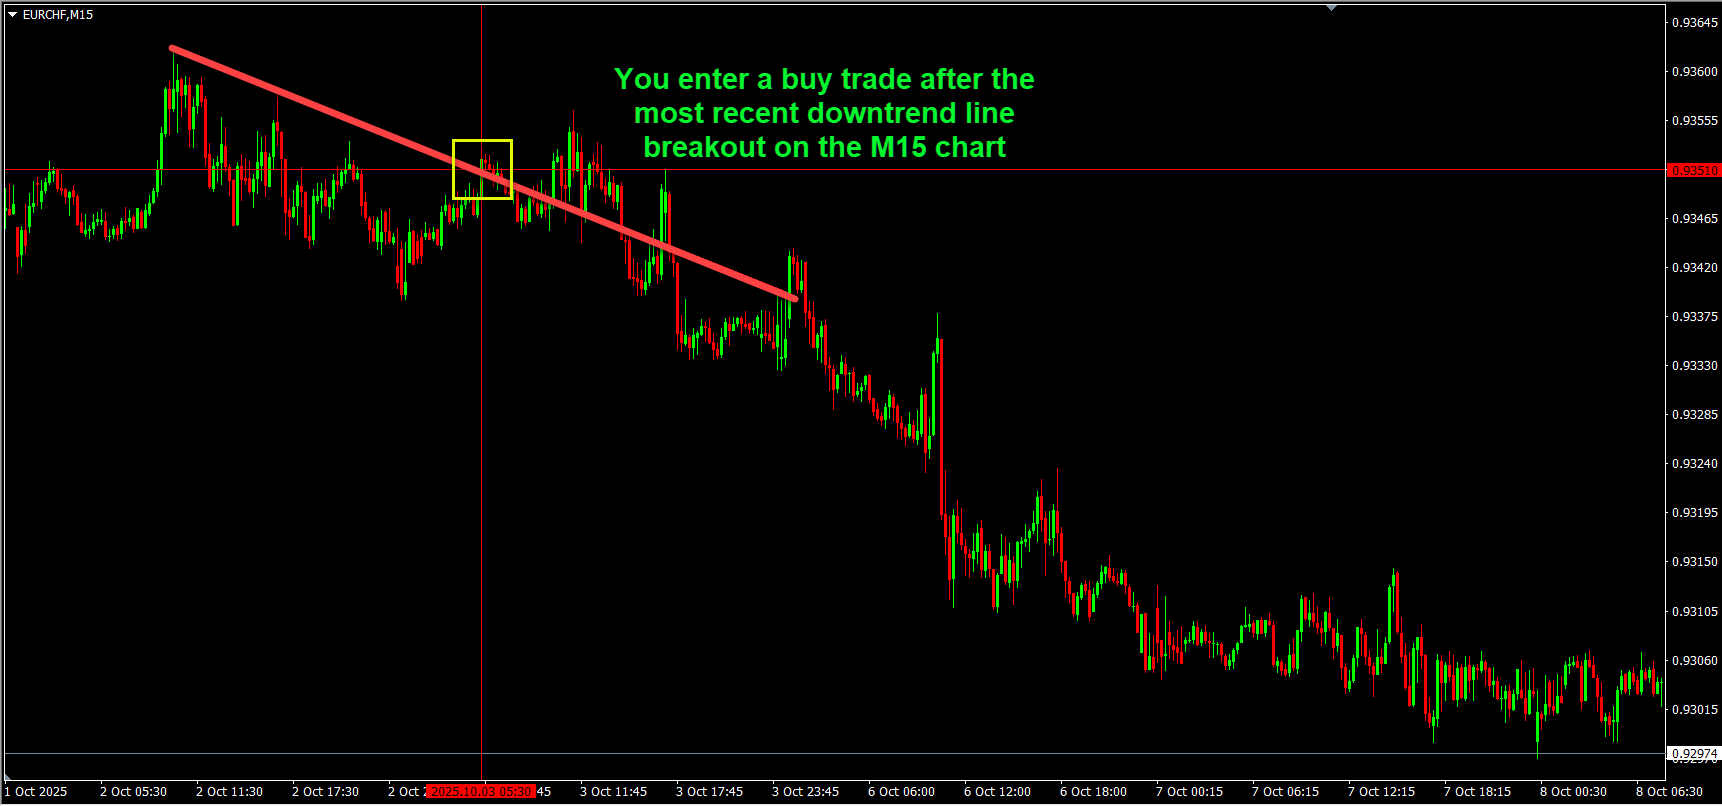 You enter a buy trade on a 15-minute chart because you see a tempting breakout above a trend line, like in the example below –
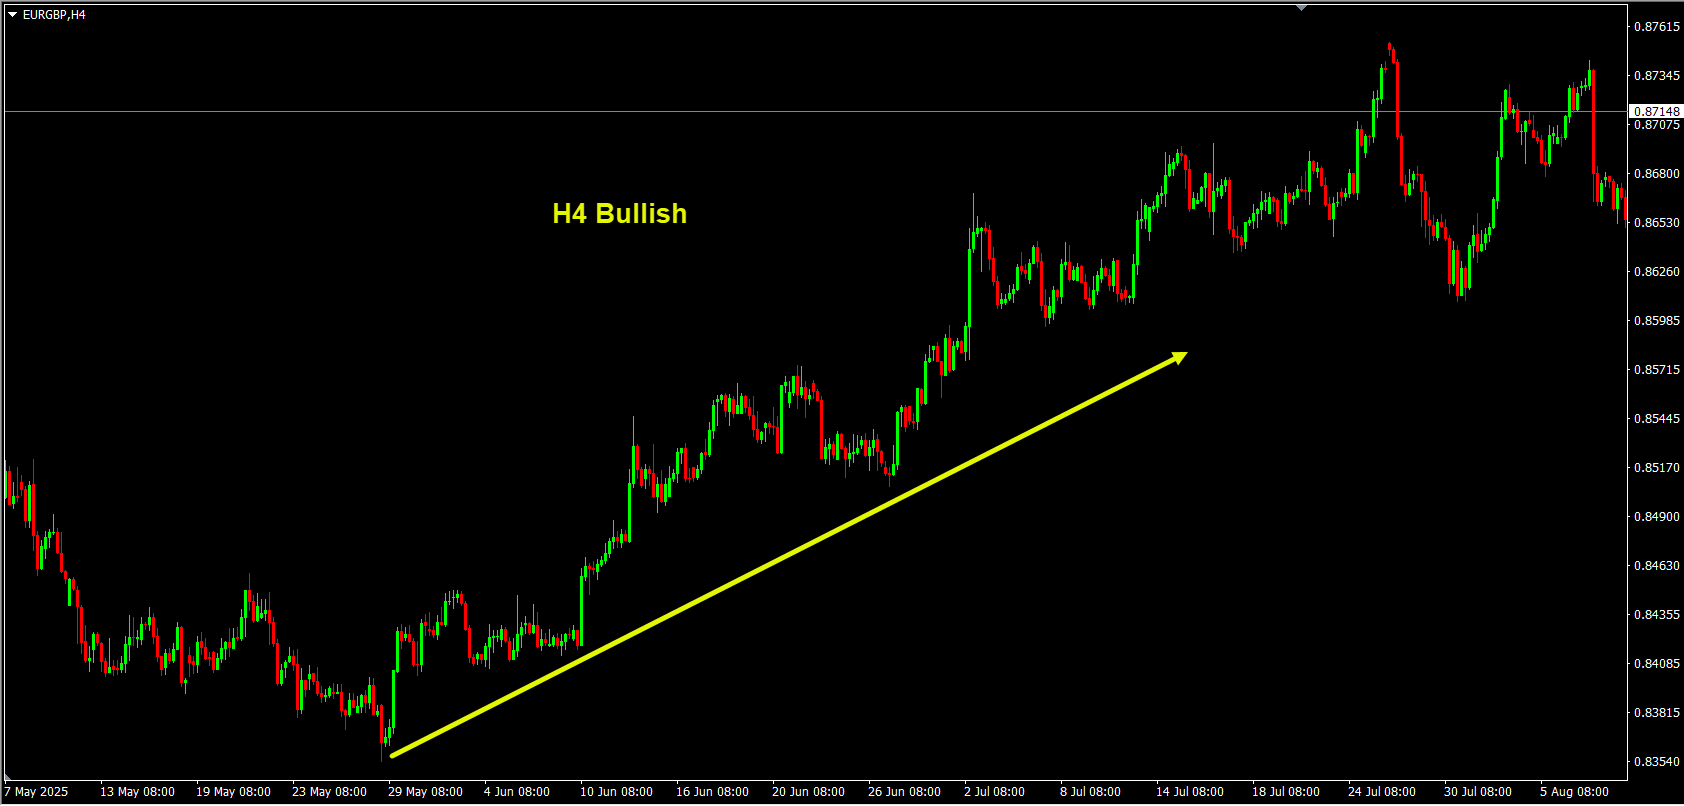
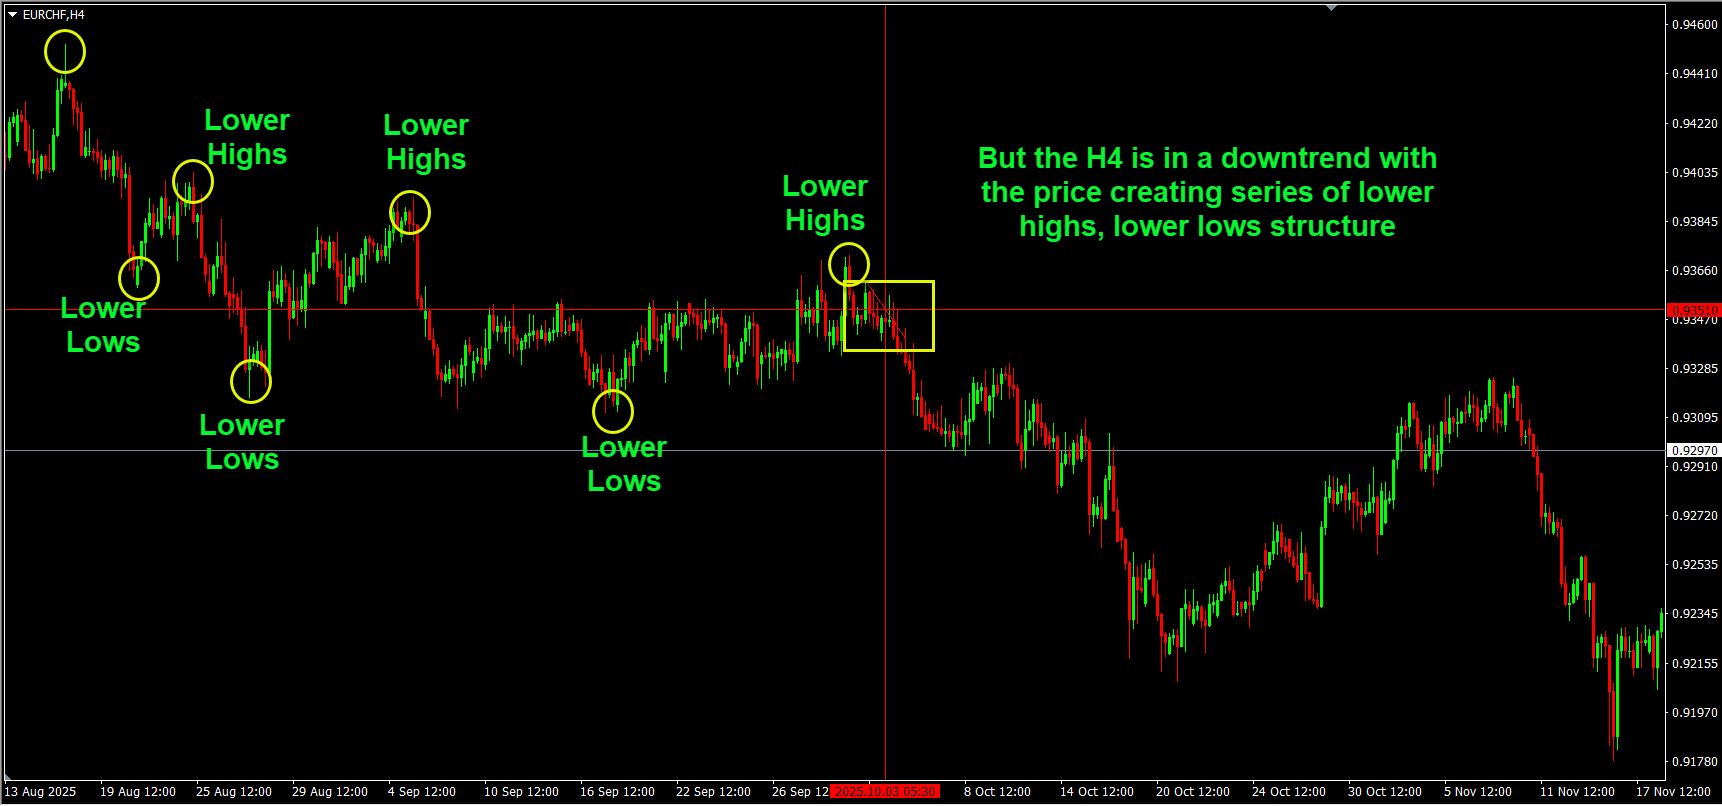 BUT, a quick look at the 4-hour chart shows that there is a CLEAR downtrend.
What do you think happens most of the time?
SL is almost always guaranteed!
👉 The trade gets hit by the larger directional force and fails — even though your 15-min signal looked perfect.
This is the reason:
Timeframes don’t give conflicting signals — but ignoring the bigger context does.
When price is aligned across timeframes:
✔ Trend direction makes sense ✔ Support/resistance levels confirm each other ✔ Entries feel better psychologically ✔ Risk becomes clearer and more manageable
In short: alignment reduces guesswork and increases probability.
BUT, a quick look at the 4-hour chart shows that there is a CLEAR downtrend.
What do you think happens most of the time?
SL is almost always guaranteed!
👉 The trade gets hit by the larger directional force and fails — even though your 15-min signal looked perfect.
This is the reason:
Timeframes don’t give conflicting signals — but ignoring the bigger context does.
When price is aligned across timeframes:
✔ Trend direction makes sense ✔ Support/resistance levels confirm each other ✔ Entries feel better psychologically ✔ Risk becomes clearer and more manageable
In short: alignment reduces guesswork and increases probability.

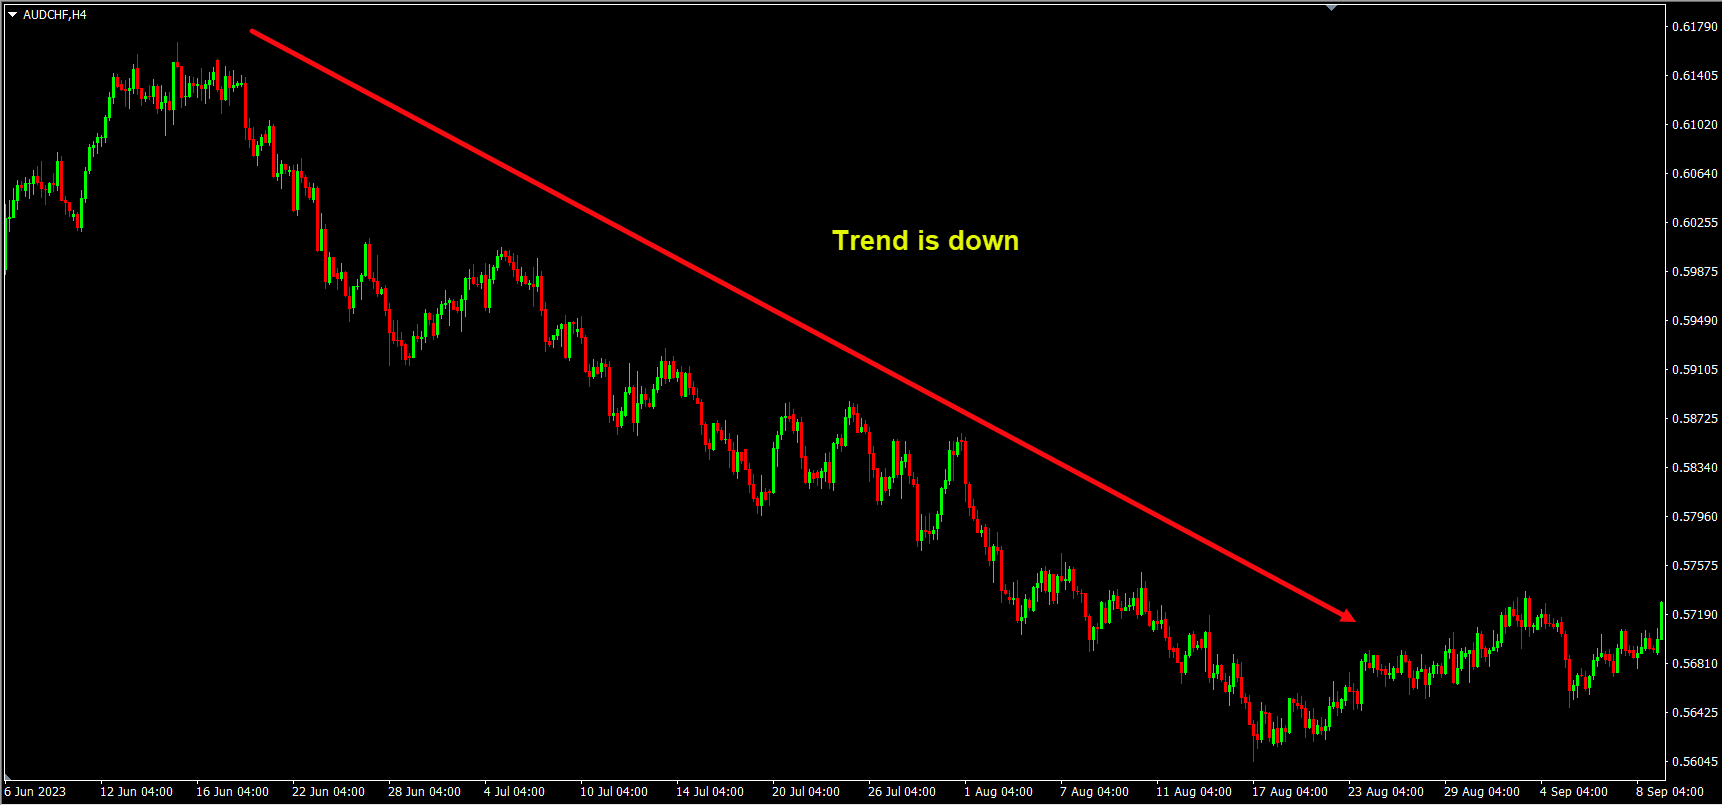
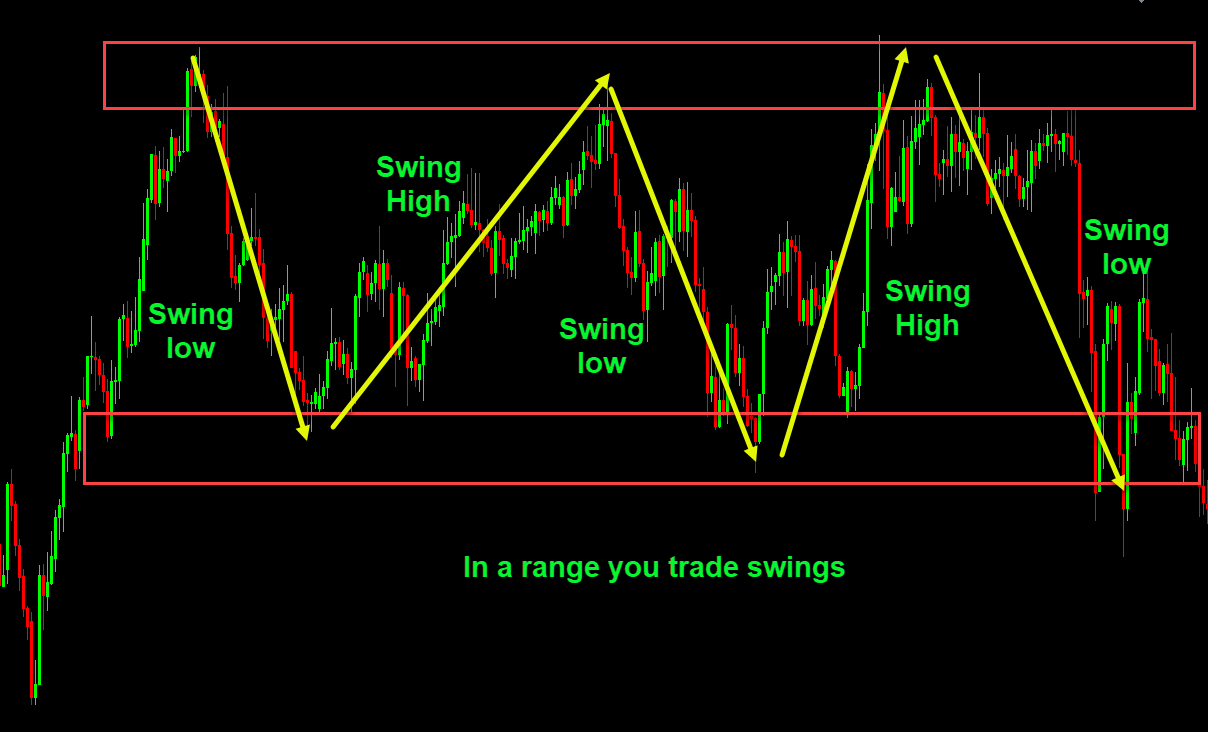 If the trend is up → look for buy opportunities. If the trend is down → look for sell opportunities. If it’s range → you trade swings, not breakouts.
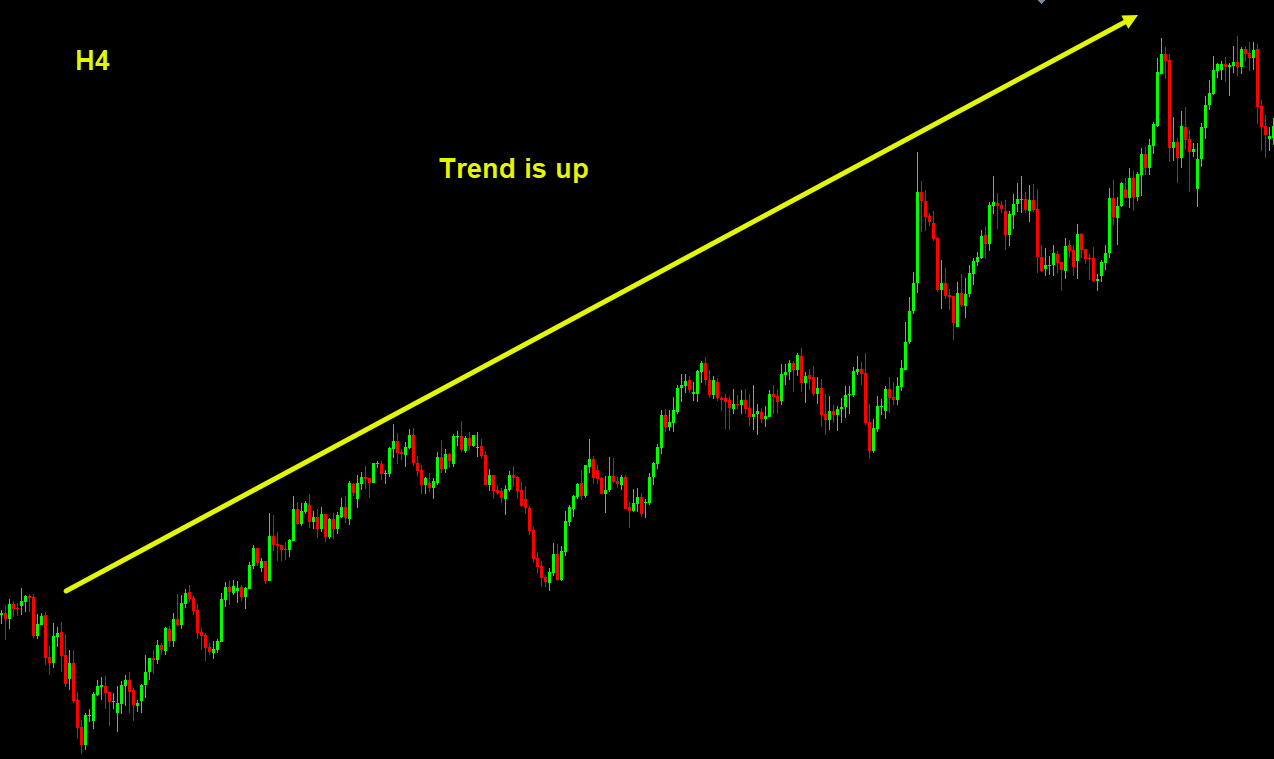
 If the higher time frame is bullish and the middle time frame is also rising → prepare for long entries.
If a higher time frame is bullish but the middle time frame is bearish → consider skipping or waiting for better opportunities.
If the higher time frame is bullish and the middle time frame is also rising → prepare for long entries.
If a higher time frame is bullish but the middle time frame is bearish → consider skipping or waiting for better opportunities.
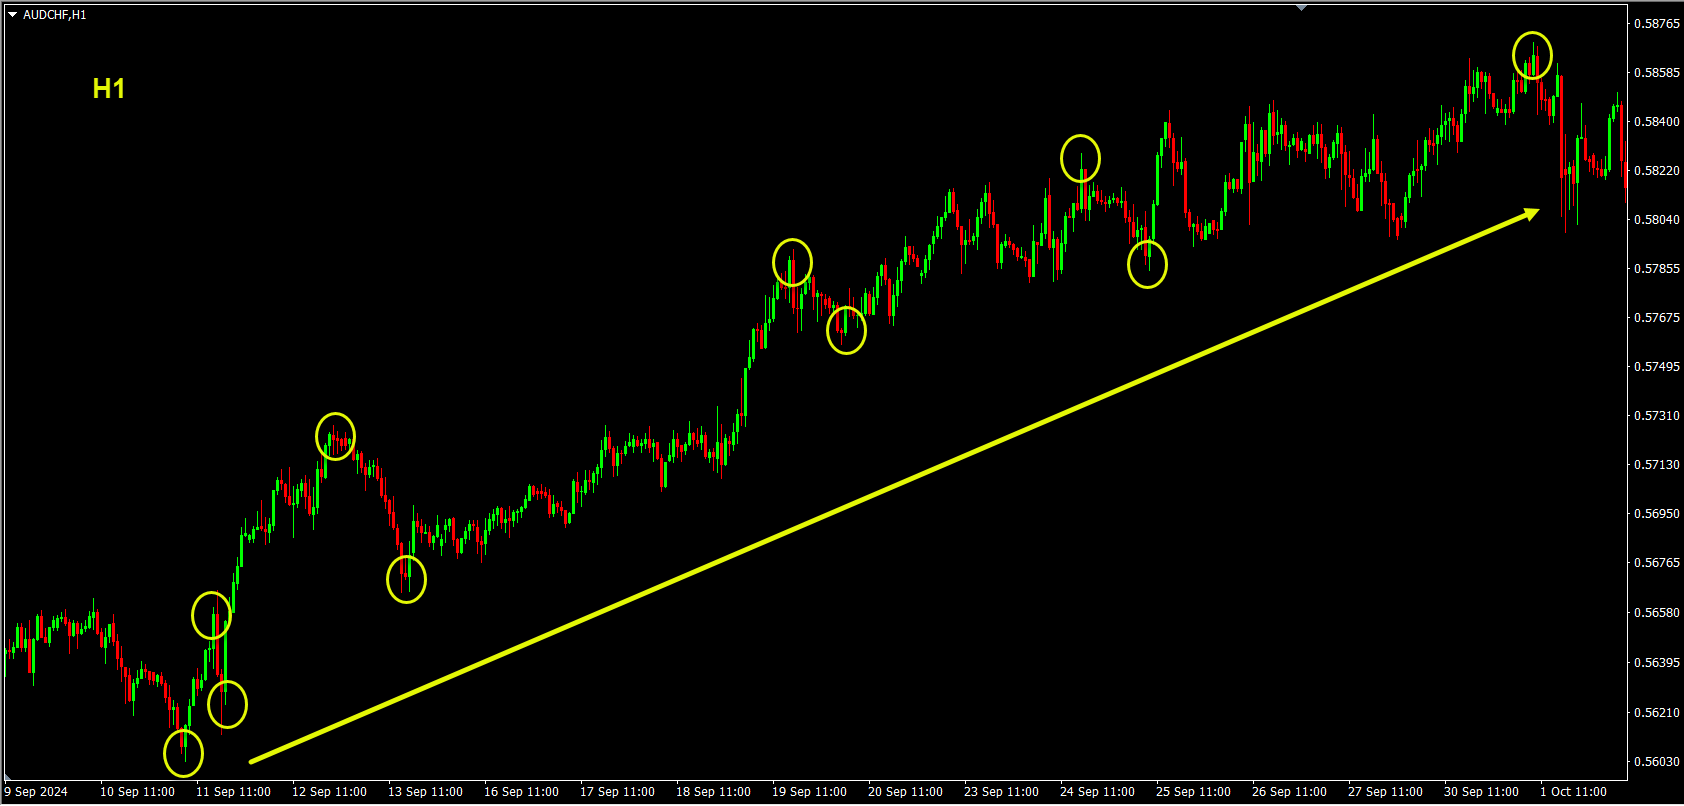
 On the 15-min chart, the price returns to that 4-hour / 1-hour support level and shows a bullish candlestick pattern.
This is the ideal alignment:
🔹 Higher timeframe trend: bullish 🔹 Middle timeframe structure: corrective pullback to support zone, ready for trend continuation 🔹 Lower timeframe trigger: precise entry with a breakout
This increases the odds of a successful trade — not guaranteed, but statistically more reliable.
On the 15-min chart, the price returns to that 4-hour / 1-hour support level and shows a bullish candlestick pattern.
This is the ideal alignment:
🔹 Higher timeframe trend: bullish 🔹 Middle timeframe structure: corrective pullback to support zone, ready for trend continuation 🔹 Lower timeframe trigger: precise entry with a breakout
This increases the odds of a successful trade — not guaranteed, but statistically more reliable.
Many traders struggle because they look at price movements in isolation — just one chart, one timeframe, one perspective. But the market isn’t one-dimensional. It moves in layers, and each timeframe tells a piece of the story.
In this article, we’ll explore:
✔ What a multi-timeframe strategy actually means ✔ Why alignment matters ✔ How to build a workflow that simplifies your decisions ✔ Common mistakes traders make ✔ A step-by-step action plan you can use immediately
Let’s break it down in simple, friendly language — no fluff, no confusion, just clarity. 🚀
🧠 1. What Does “Multi TimeFrame Strategy” Mean?
A Multi TimeFrame Strategy (middle time frame) is simply the practice of using more than one chart timeframe to understand the market. Think of it like zooming in and out of a photo: 📸 Zoomed out (higher timeframe) — you see the overall shape, context, and direction. 🔍 Zoomed in (lower timeframe) — you see texture, detail, and precise levels. Forex doesn’t move in a vacuum. Every price move is connected across time. So if you want meaningful setups with better odds, you have to see the market in multiple layers.🏗️ 2. Why Multi-TimeFrame Alignment Is a Game Changer
Imagine this scenario:
You enter a buy trade on a 15-minute chart because you see a tempting breakout above a trend line, like in the example below –
BUT, a quick look at the 4-hour chart shows that there is a CLEAR downtrend.
What do you think happens most of the time?
SL is almost always guaranteed!
👉 The trade gets hit by the larger directional force and fails — even though your 15-min signal looked perfect.
This is the reason:
Timeframes don’t give conflicting signals — but ignoring the bigger context does.
When price is aligned across timeframes:
✔ Trend direction makes sense ✔ Support/resistance levels confirm each other ✔ Entries feel better psychologically ✔ Risk becomes clearer and more manageable
In short: alignment reduces guesswork and increases probability.
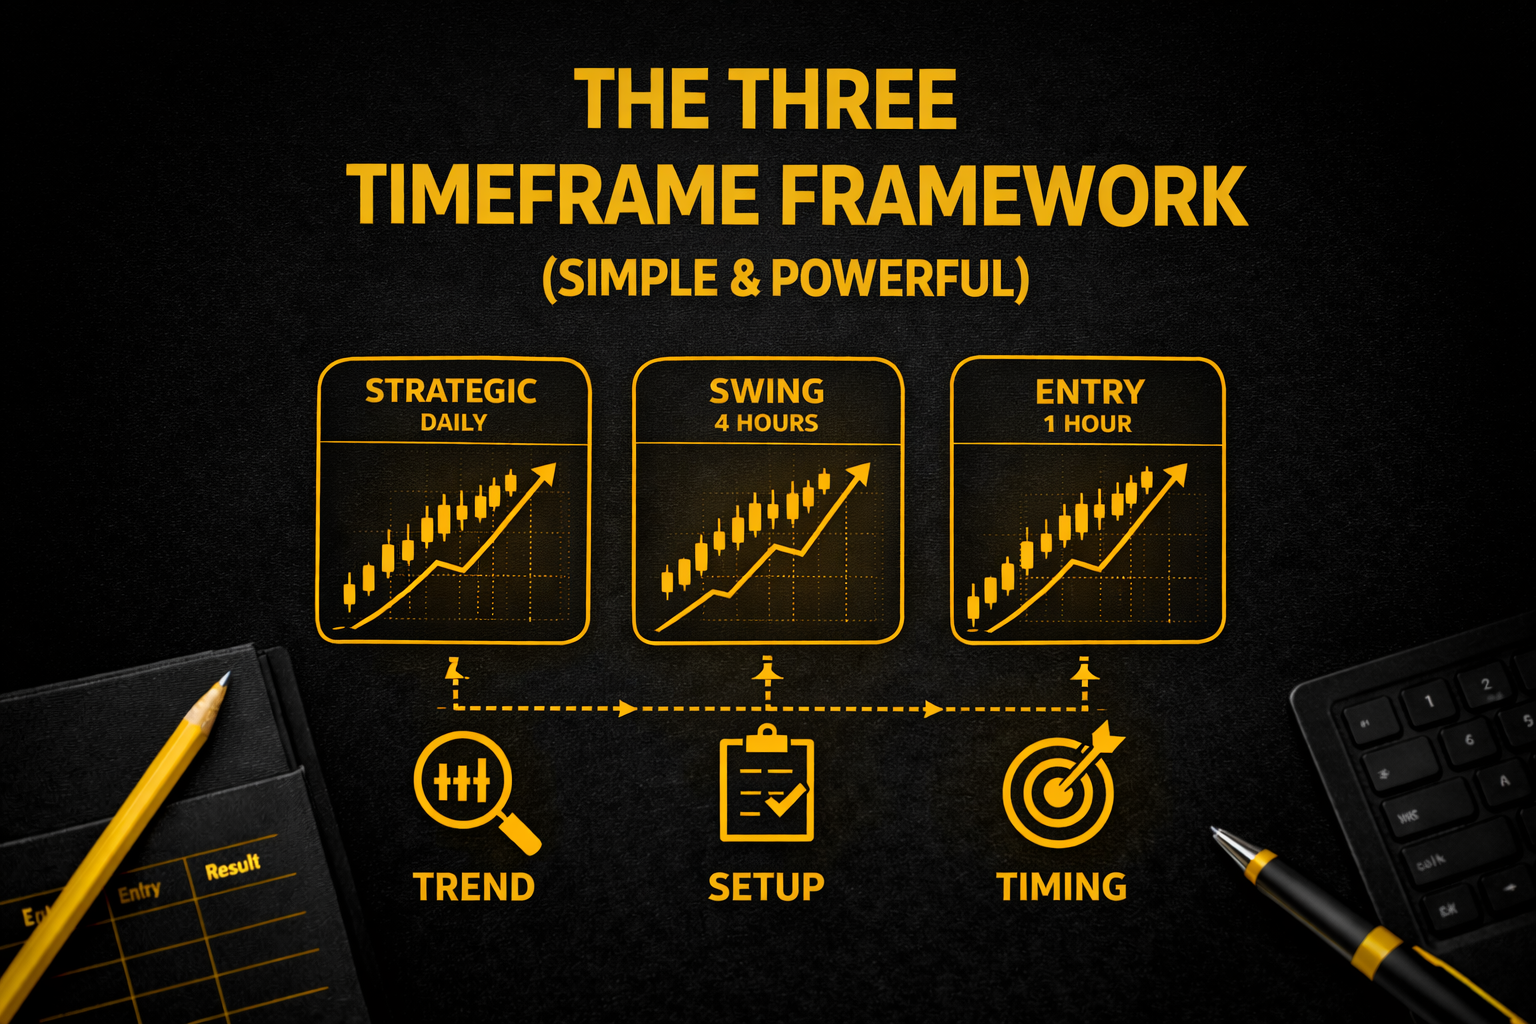
🧭 3. The Three Timeframe Framework (Simple & Powerful)
The most common and useful method is the Three Timeframe Framework:- Higher Timeframe – Big Picture (higher time frames)
- Middle Timeframe – Market Context (middle time frame)
- Lower Timeframe – Entry / Precision (lower time frame)
🔹 1. Higher Timeframe — The Big Picture
This is your compass. Common Higher time frames: Weekly Daily 4-Hour What it tells you:- Is price trending or ranging?
- Where is major support or resistance?
- Is market structure bullish or bearish?
🔹 2. Middle Timeframe — Market Context
This is your map. Common Middle time frames: 1-Hour 2-Hours 4-hours What it tells you:- Intermediate trend strength
- Pullbacks and corrections
- Confirmation of higher time frames (Higher time frame) direction
🔹 3. Lower Timeframe — Entry Precision
This is your trigger. Common Lower time frames: ✔ 15-min ✔ 5-min ✔ 1-min (for scalpers) What it tells you:- Entry signals
- Candlestick patterns
- Precise entries, stops, and targets
🔄 4. How to Align Timeframes — Step by Step
Let’s walk through an actionable routine you can use every day:STEP 1 — Look at the Higher Timeframe
Ask yourself the following questions:🟢 Is the trend up, down, or sideways?
🟢 Is the price above or below major moving averages?
🟢 Are there valid support/resistance levels around?
If the trend is up → look for buy opportunities. If the trend is down → look for sell opportunities. If it’s range → you trade swings, not breakouts.
👉 Write down the directional bias.
STEP 2 — Check the Middle Timeframe
Ask: 📌 Does this timeframe confirm the direction from the higher time frame? 📌 Is the price structure clear (higher highs/higher lows or lower lows/lower highs)? 📌 Can you see corrective moves forming? Only take setups on your aligned side. For example:
If the higher time frame is bullish and the middle time frame is also rising → prepare for long entries.
If a higher time frame is bullish but the middle time frame is bearish → consider skipping or waiting for better opportunities.
STEP 3 — Enter the Lower Timeframe
Now shift to a lower time frame. You’re looking for precise price action signals:
🔹 Pullback to key level
🔹 Break of structure
🔹 Reversal candlestick
🔹 Confluence with indicator support
📌 Lower-timeframe entries should only be taken when they align with the direction established on higher and mid timeframes.
Example: If higher time frame + middle time frame are bullish → only take bullish signals in lower time frame.STEP 4 — Manage Risk Based on Higher Timeframes
Don’t place your stop loss arbitrarily. 📌 Stop loss should be placed based on higher timeframe structure (support/resistance or swing levels) — not just the lower timeframe entry That gives your trade room to breathe and prevents noise-related stop-outs.🎯 5. Why This Works — In Simple Terms
Because markets are hierarchical. Timeframes stack like: 📈 Big trend ⬇ Corrections within that trend 🔁 Entries within that correction You want trades that are: ✔ In the direction of the broader trend ✔ Confirmed by intermediate structure ✔ Triggered with precision This brings probability to your side.
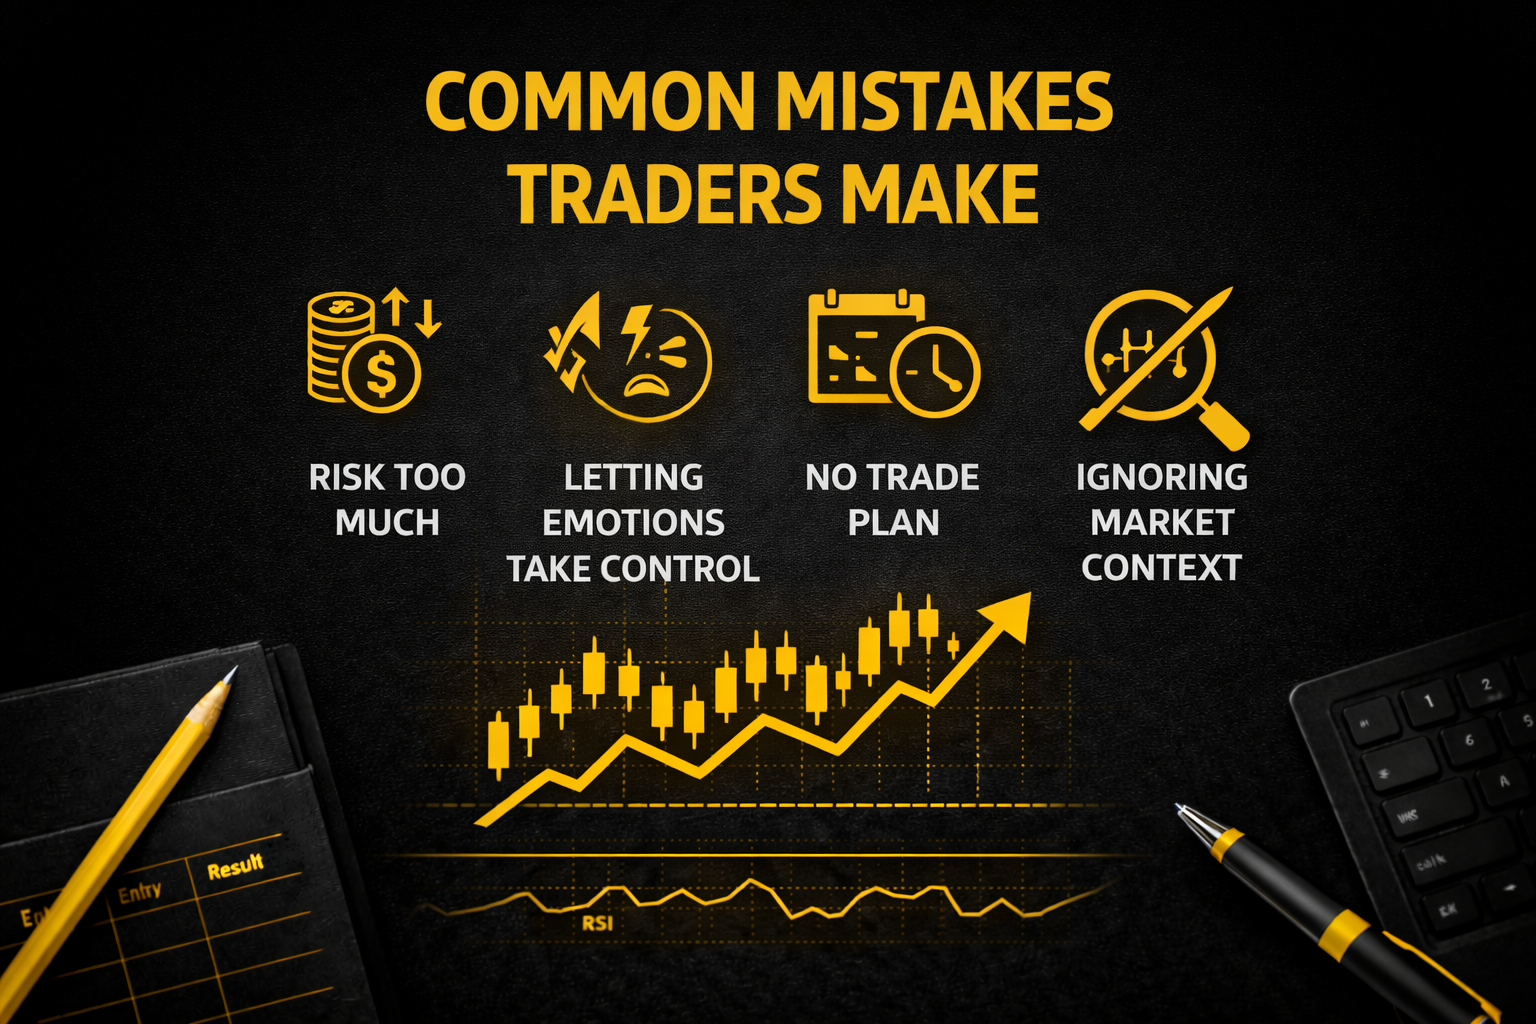
⚠️ 6. Common Mistakes Traders Make
❌ Mistake 1 — Trading Only One Timeframe
Traders often rely on a 5-min or 1-hour chart without context. That’s like navigating with a magnifying glass — great for details, but useless for direction.❌ Mistake 2 — Conflicting Signals
If higher time frames and middle time frames aren’t aligned, most signals are just noise.❌ Mistake 3 — Ignoring Market Structure
Signals without structure are just lucky guesses.❌ Mistake 4 — Poor Risk Placement
Placing stops based on the smallest timeframe ensures early stop-outs.💡 7. A Simple Rule to Live By
📌 Trade only when multiple timeframes agree. Trend + Structure + Trigger = Trade. If any part is missing → wait.📈 8. Real Example to Cement the Concept
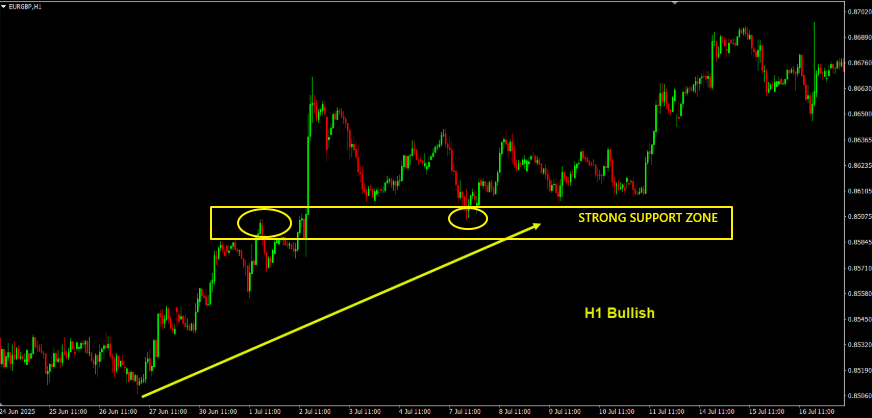
Imagine the 4H chart is trending bullish. The 1-Hour chart recently pulled back and formed a support level.
On the 15-min chart, the price returns to that 4-hour / 1-hour support level and shows a bullish candlestick pattern.
This is the ideal alignment:
🔹 Higher timeframe trend: bullish 🔹 Middle timeframe structure: corrective pullback to support zone, ready for trend continuation 🔹 Lower timeframe trigger: precise entry with a breakout
This increases the odds of a successful trade — not guaranteed, but statistically more reliable.