Hello traders,
In this article, we’re going to talk about something beautifully simple yet extremely powerful: single-candle patterns.
While the Forex market is full of indicators, algorithms, and complicated tools, sometimes the most reliable clues come from the smallest visual signals on the chart. A single candle can tell you who is winning the battle — bulls or bears — and where the next opportunity might come from.
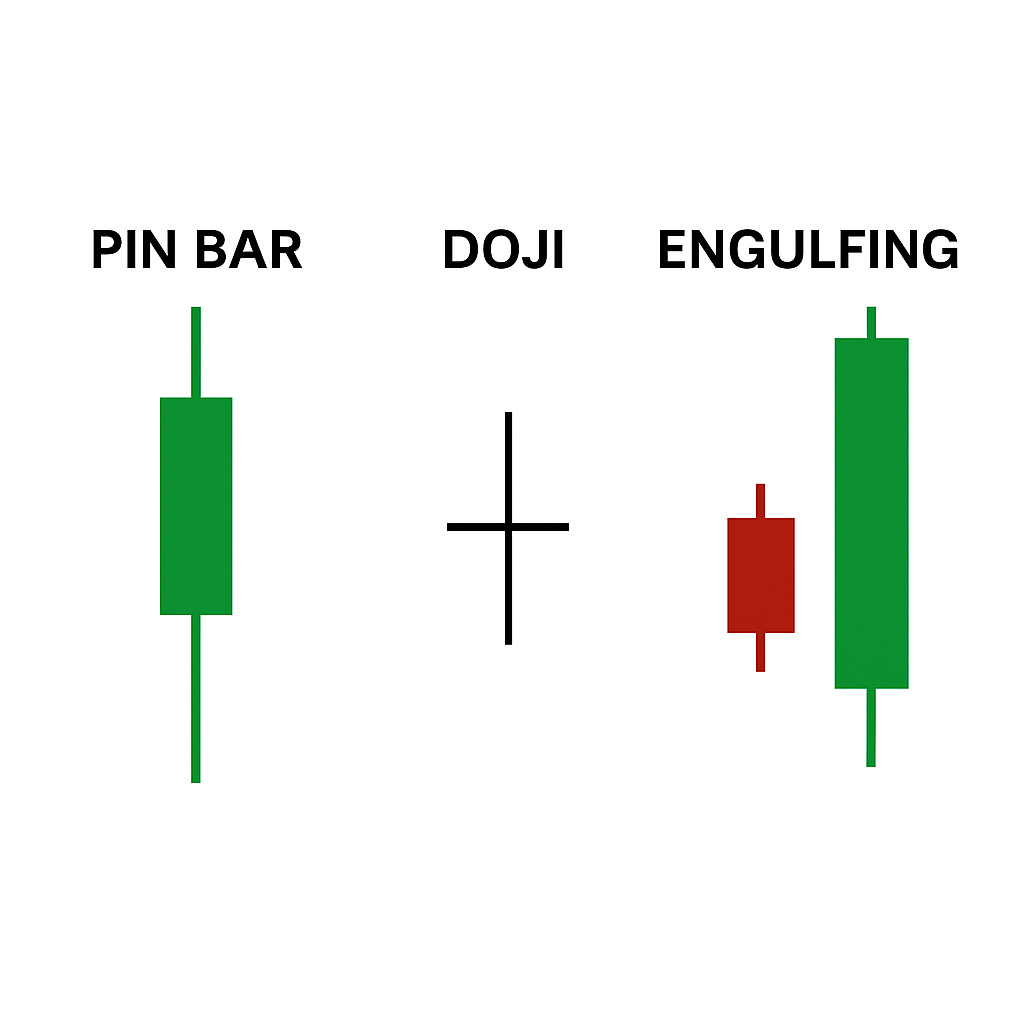
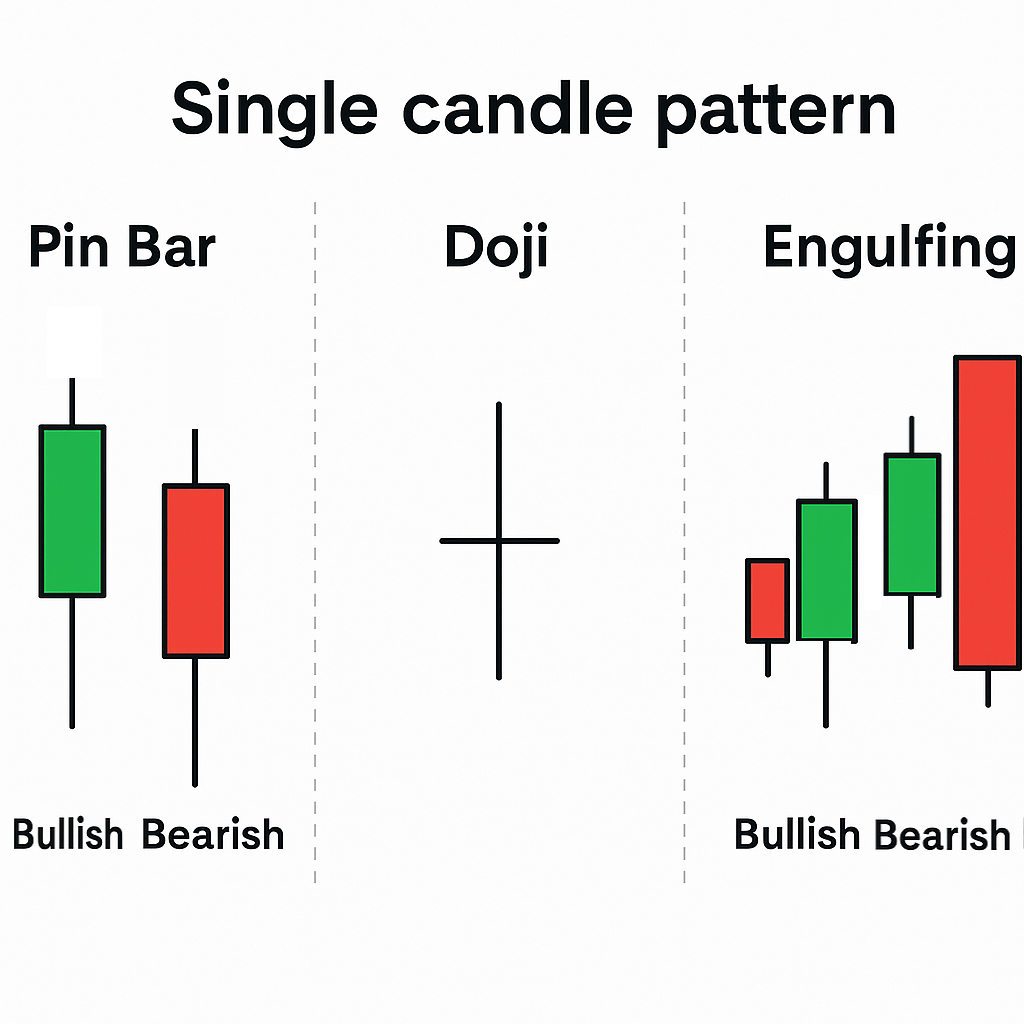
In this article, I’ll break down the three most commonly used single-candle patterns:
 We’ll discuss what they mean, how to read them, and how to use them properly — including their biggest pitfalls.
Let’s dive in!
We’ll discuss what they mean, how to read them, and how to use them properly — including their biggest pitfalls.
Let’s dive in!
 Let’s look at each one individually.
 Example – Bullish Pin Bar
 Example – Bullish Scenario
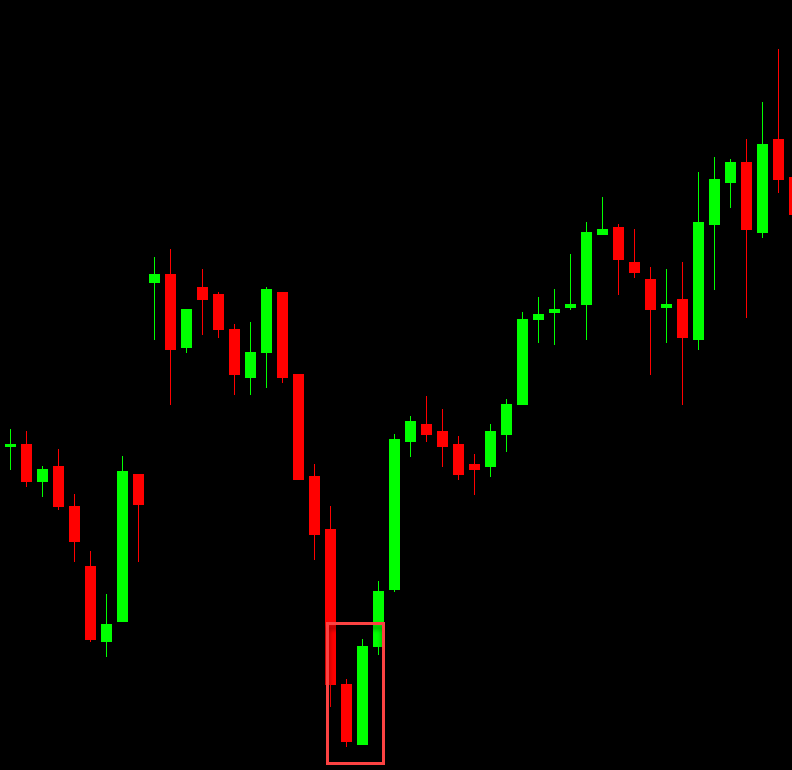
 Example of Bullish Engulfing
 Doji → indecision
 Engulfing → shift in momentum

- Pin Bar
- Doji
- Engulfing Candle
We’ll discuss what they mean, how to read them, and how to use them properly — including their biggest pitfalls.
Let’s dive in!
Why Single-Candle Patterns Matter
Here’s the truth many traders overlook: 👉 You don’t need ten indicators to understand market sentiment. 👉 One candle can already tell you a lot — if you know how to read it. Single-candle patterns help traders:- Spot reversals early
- Filter bad trades
- Understand buyer–seller sentiment
- Identify key support/resistance reactions
- Improve risk-to-reward by entering at the right place
Let’s look at each one individually.
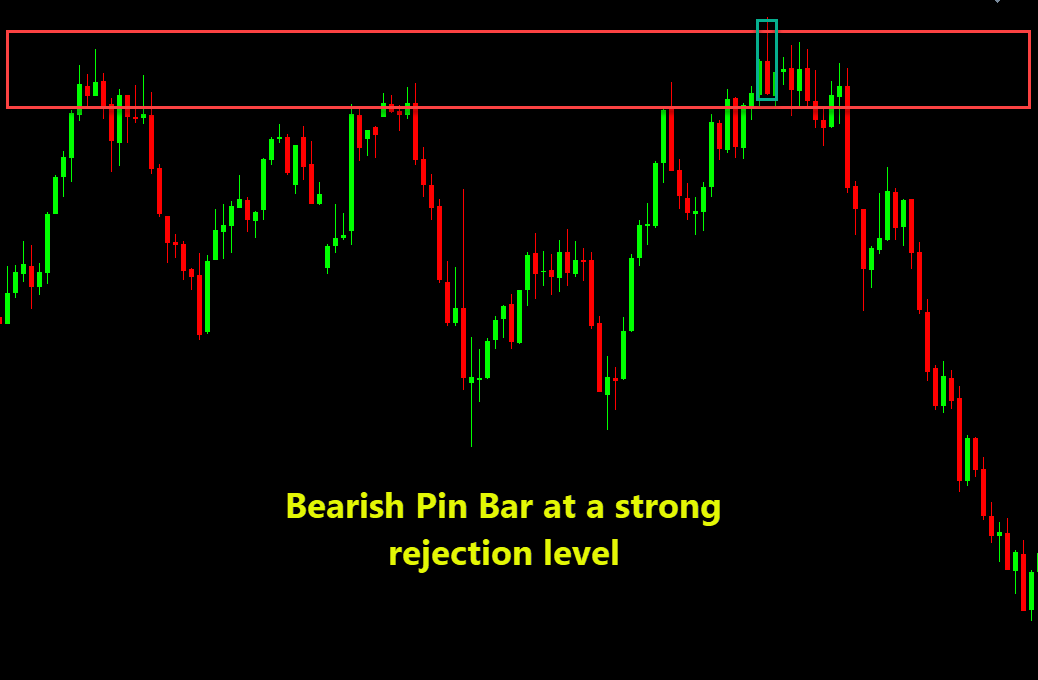
1. The Pin Bar – Market Rejection in Its Purest Form
A Pin Bar is a candle with:- A very long wick (tail)
- A small body
- Wick is pointing opposite the intended direction
✔ What the Pin Bar Tells You
The pin bar is the clearest form of market rejection. Here’s the story behind it:- Price moved strongly in one direction
- It met strong counter-pressure
- The opposite side pushed price back to (or beyond) the open
- The wick shows where the losing side was defeated
- The small body shows where the winners closed the candle
✔ Best Places to Trade Pin Bars
Pin bars work best when they appear at:- Key support resistance zones
- Trend continuation pullbacks
- Supply and demand zones
- Market structure turning points
✔ A Pin Bar Pitfall to Avoid
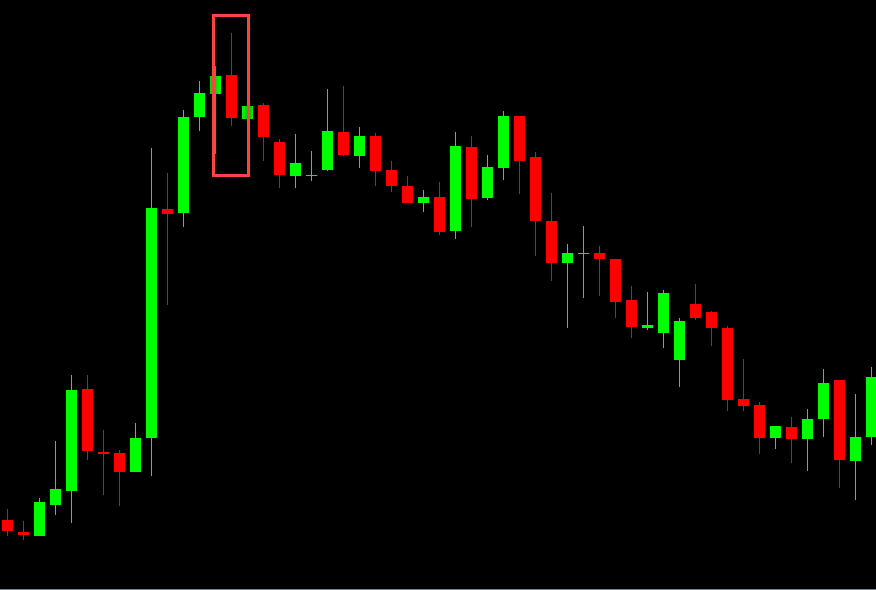
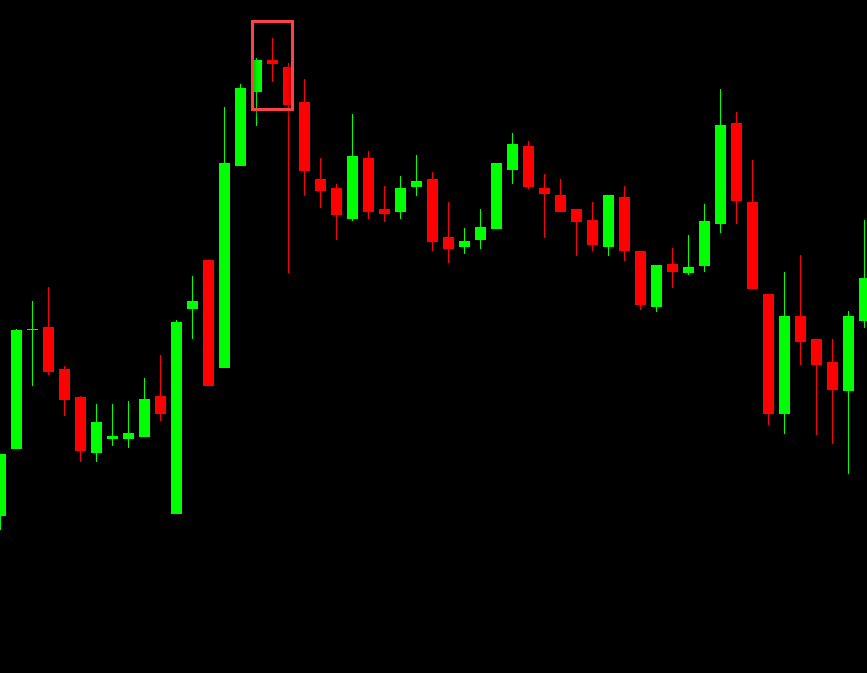
Never trade a pin bar against overwhelming momentum. If price is trending strongly, one pin bar won’t stop it. Wait for the trend to slow down or for extra confirmation. Example – Bearish Pin Bar
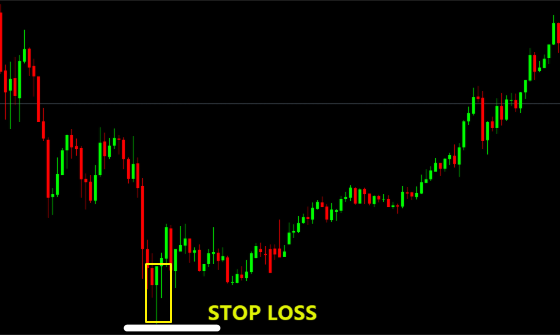
Example – Bullish Pin Bar
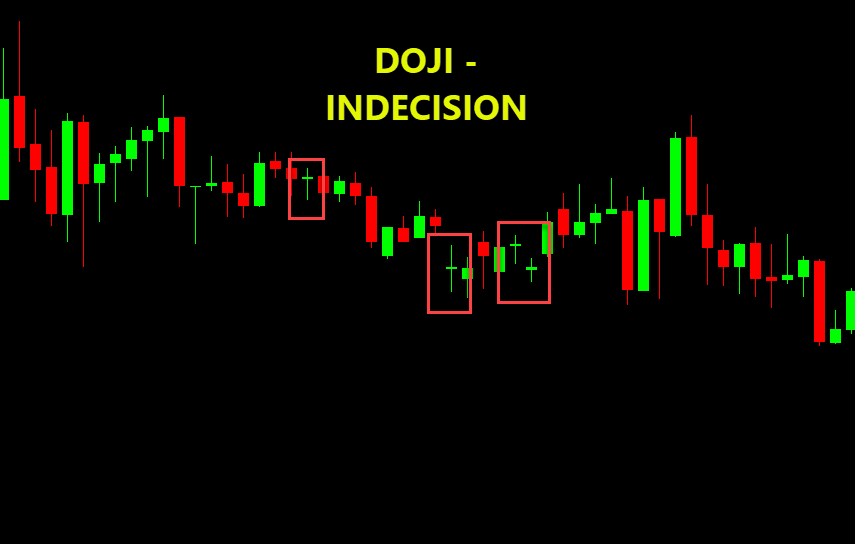
2. The Doji – The Candle of Indecision
A Doji is a candle with:- Very small or non-existent body
- Wicks on both sides
- Open ≈ Close
✔ What the Doji Tells You
A doji means:- Bulls tried – failed
- Bears tried – failed
- Nobody won
- Market is waiting for clarity
✔ Best Places to Trade a Doji
Doji candles become powerful when:- They form at the end of a long trend → potential reversal. Complete a better picture of the market’s intentions with the following candles, after the doji.
- They appear at a major level → breakout or reversal coming
- They show up during consolidation → tension building
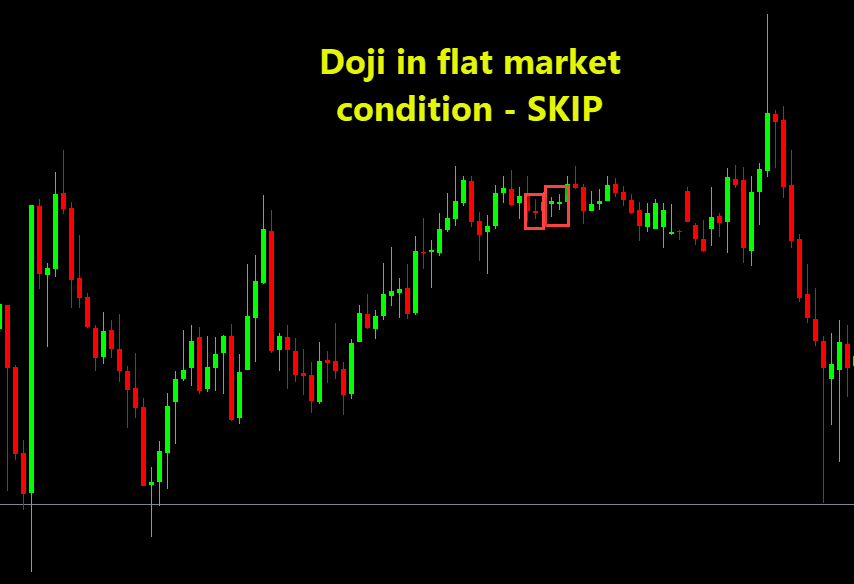
✔ Common Doji Mistake
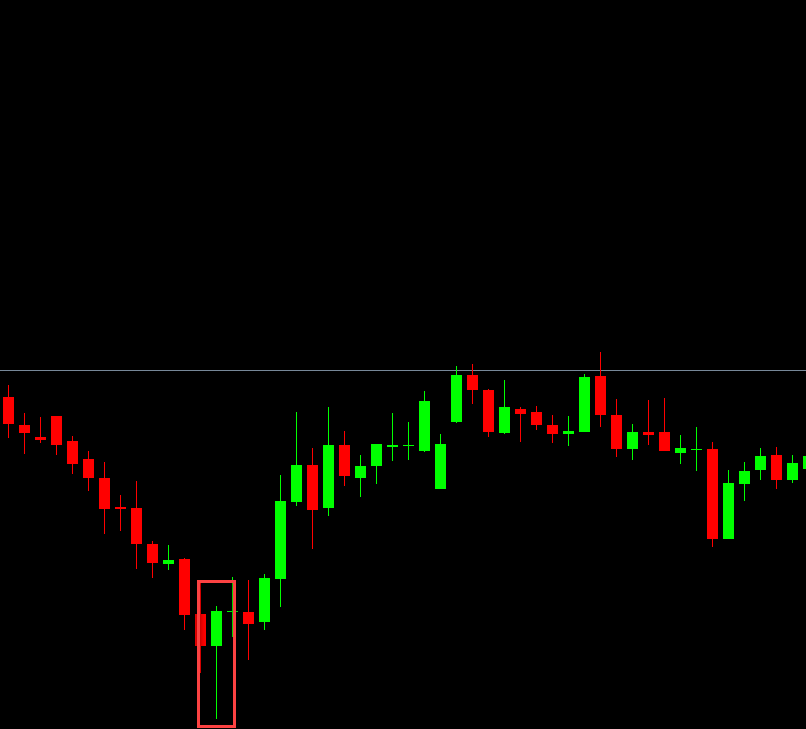
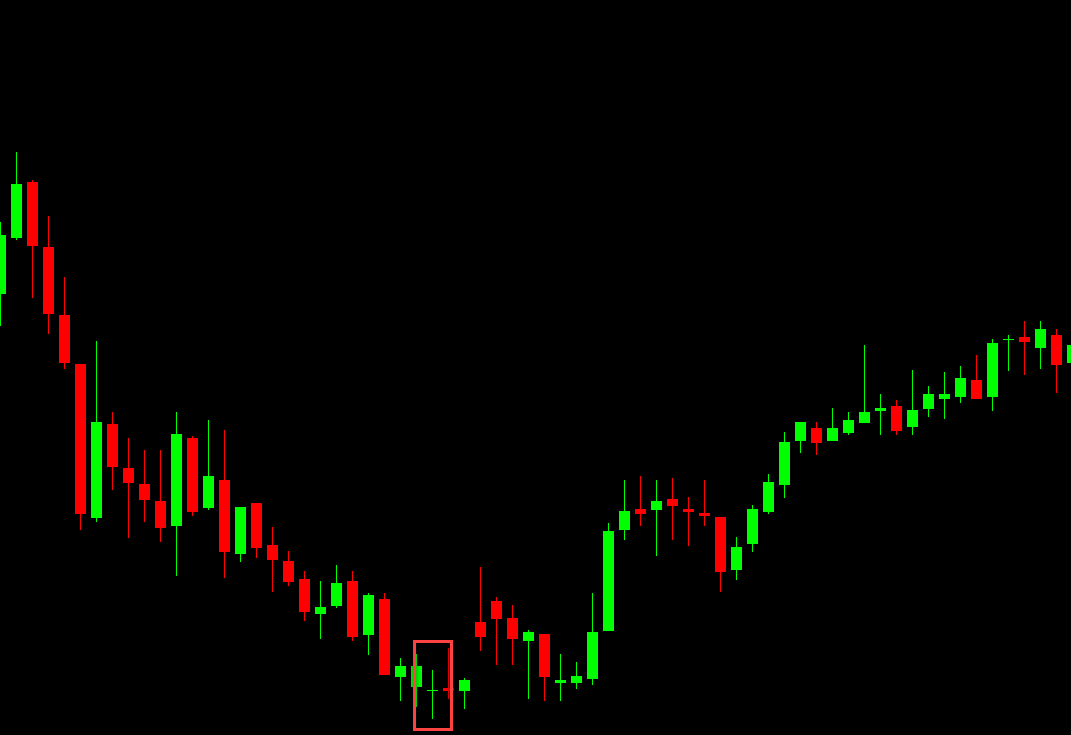
Do NOT assume a doji automatically means reversal. Sometimes, a doji is the last pause before a big breakout. Confirm with the following candles, after the doji, to complete a better picture of the market’s intentions. Example – Bearish Scenario
Example – Bullish Scenario
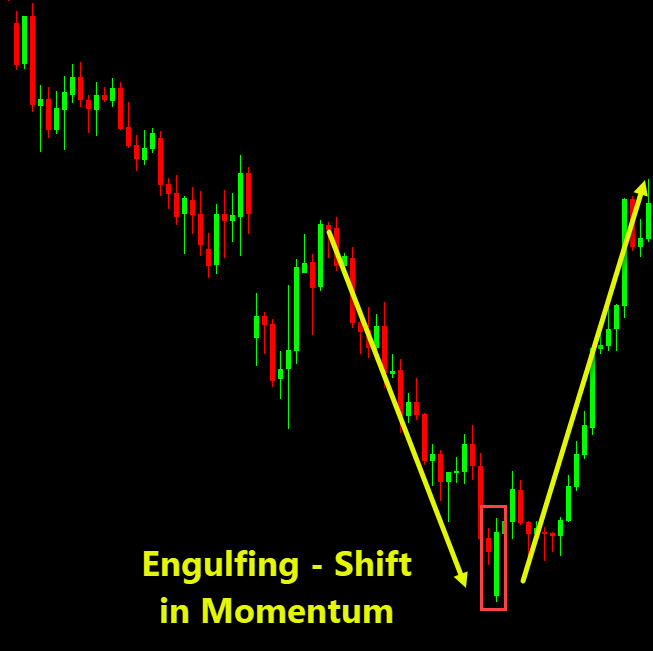
3. The Engulfing Candle — A Strong Shift in Control
The Engulfing Candle is one of the strongest single-candle patterns, even though it uses two candles (but the signal itself comes from the big one). It forms when:- The second candle completely engulfs the previous candle’s body
- Direction potentially flips (bullish/bearish reversal)
✔ What the Engulfing Candle Tells You
The story here is simple and powerful:- One side was in control
- Suddenly, the opposite side came in aggressively
- They erased the previous move and closed beyond it
- Momentum shifted instantly
✔ Where Engulfing Candles Work Best
- Trend reversal zones
- End of pullbacks
- After false breakouts
- At clear supply or demand areas
✔ Engulfing Pitfall
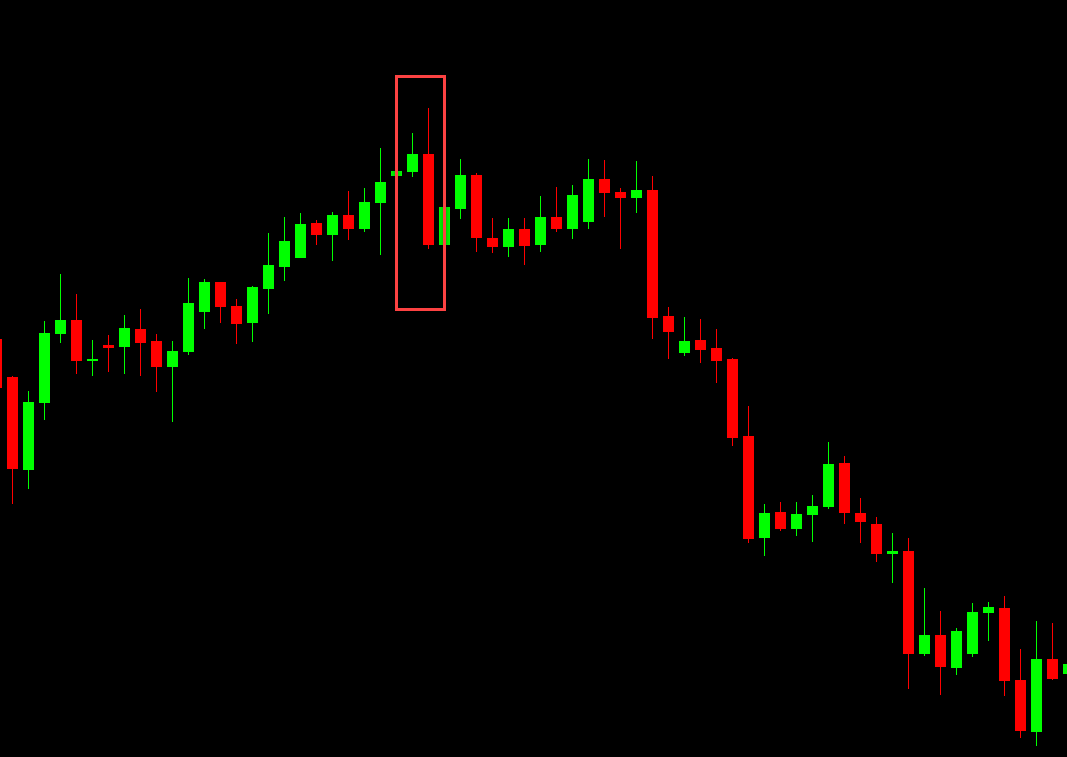
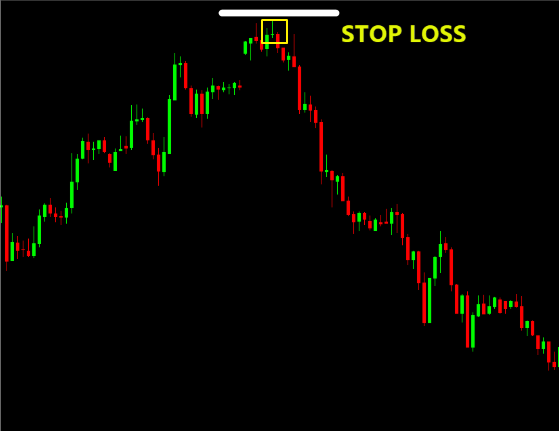
Avoid engulfing signals in very small ranges or low-volume markets. If volatility is too low, the engulfing may be meaningless. Example of Bearish Engulfing
Example of Bullish Engulfing
How to Use These Patterns in Real Tradi
Candle patterns are powerful tools — but only when used correctly. Here’s a simple, reliable approach:✔ 1. Identify the pattern
Pin bar → rejection
Doji → indecision
Engulfing → shift in momentum
✔ 2. Confirm the location
Ask: Is this candle at a meaningful level? If not, skip it.
✔ 3. Check the trend
Trade with the bigger trend unless the reversal signal is extremely strong.
✔ 4. Wait for follow-through
A candle pattern means nothing without continuation.✔ 4. Wait for follow-through
Your stop-loss should always go:- Below/above the pin bar wick
- Below/above the engulfing candle
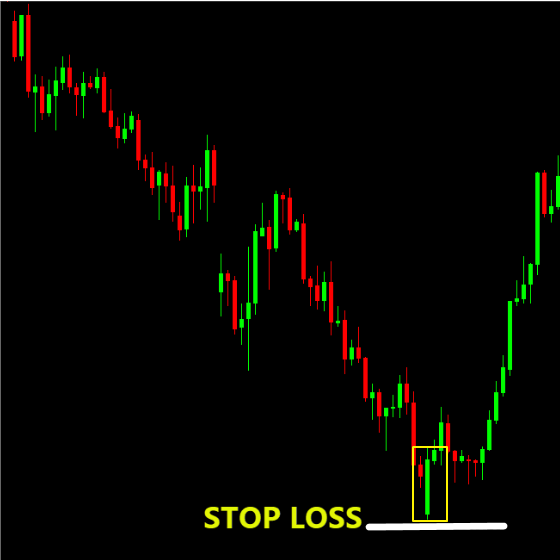
- On the opposite side of a doji structure
- Never skip risk management — no candle pattern guarantees anything.
Conclusion: One Candle, A Thousand Insights
Single-candle patterns are simple, effective, and timeless tools — especially when you combine them with structure, trend, and momentum.- The Pin Bar shows rejection
- The Doji shows indecision
- The Engulfing shows reversal power