Forex charts are always moving. Candles rise, fall, pause, and spike — sometimes for clear reasons, sometimes for no obvious reason at all.
This is where many traders get stuck.
They see the price move… They enter too early… And moments later, the move fades or reverses.
The problem is not the price itself. The problem is trading price without confirmation .
Two elements help you separate real market intent from random fluctuation:
 Is this move supported by real evidence, or is it just noise?
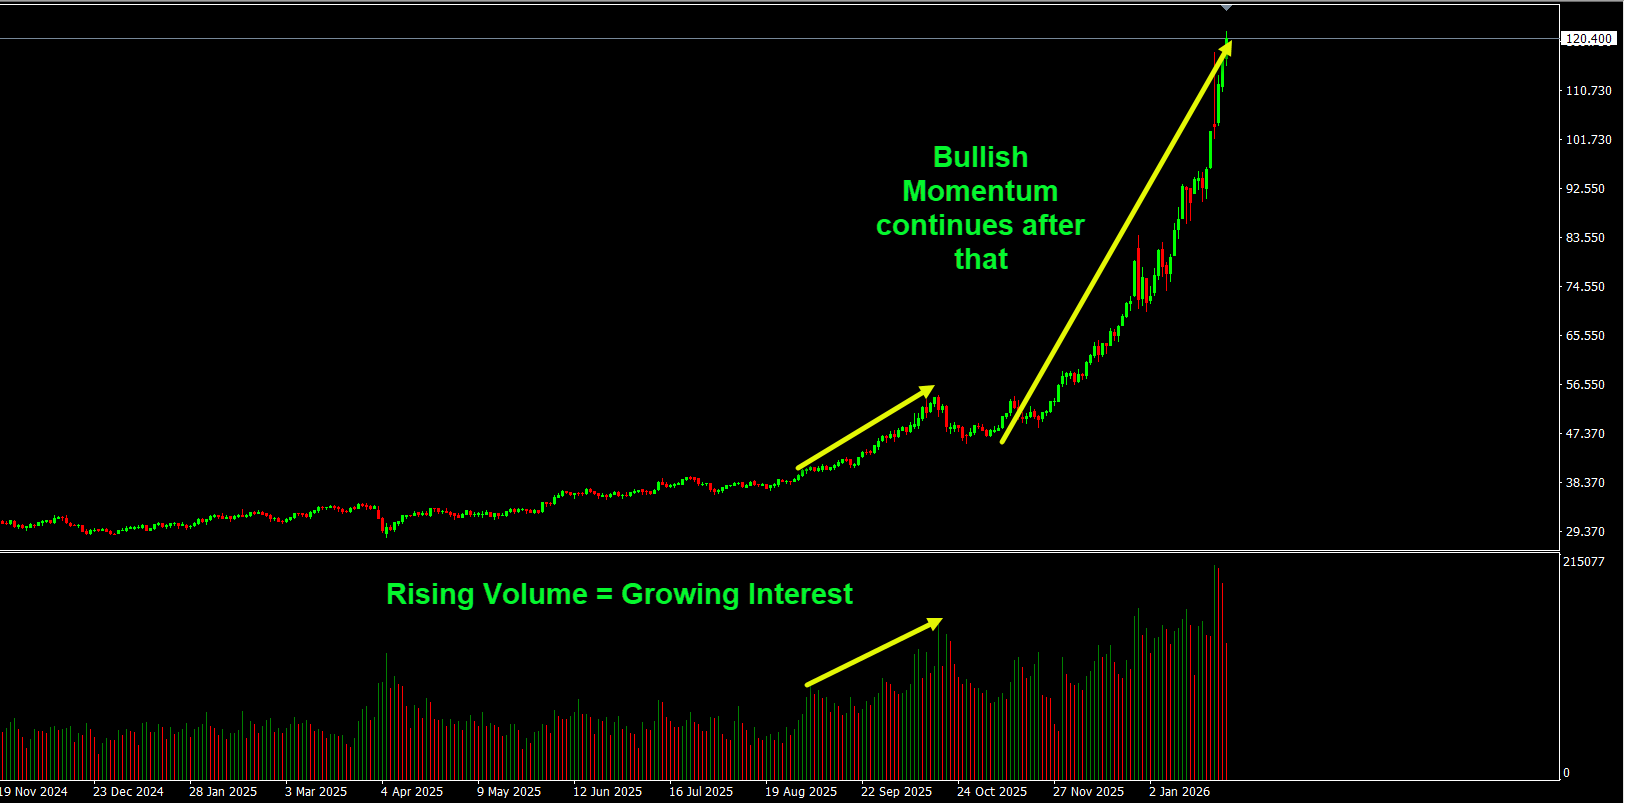 • Rising volume = growing interest and participation
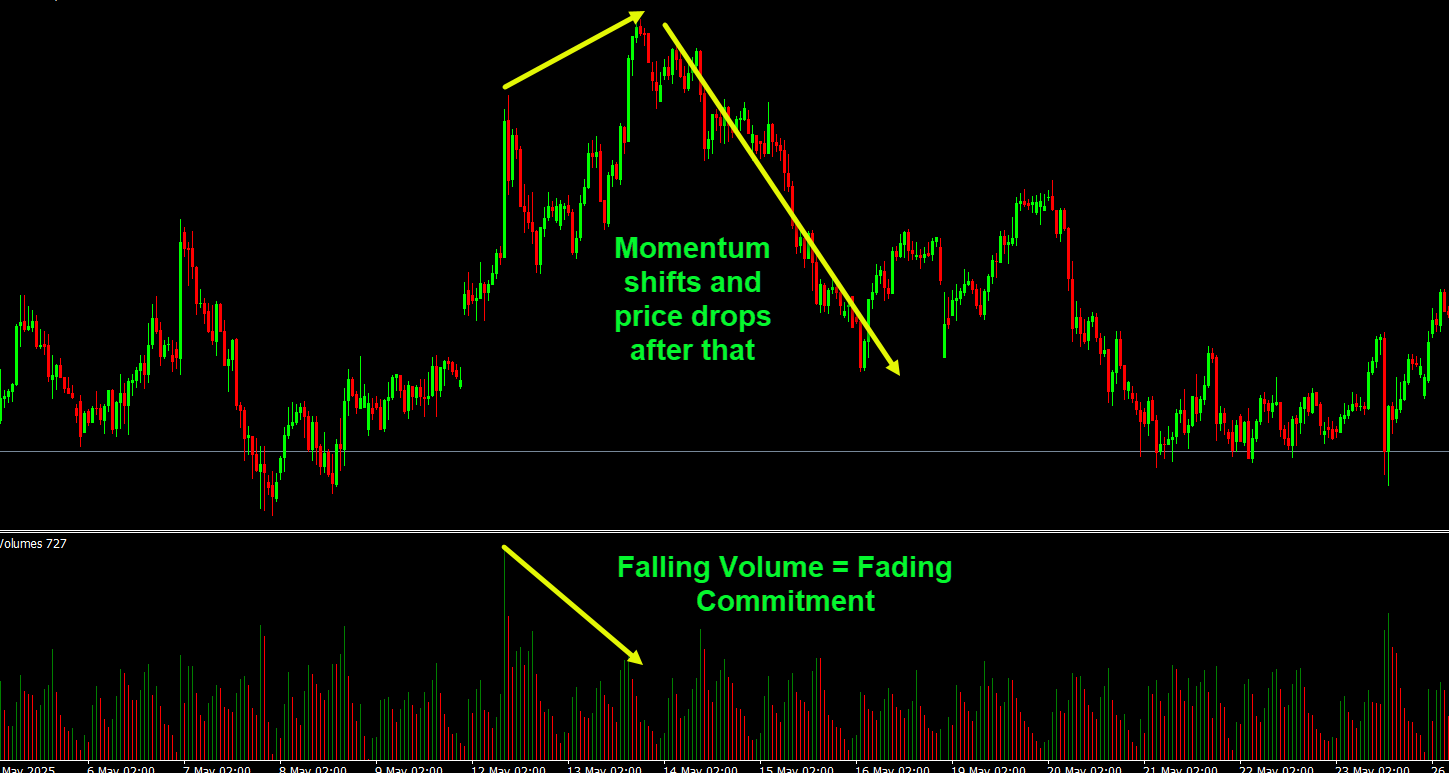
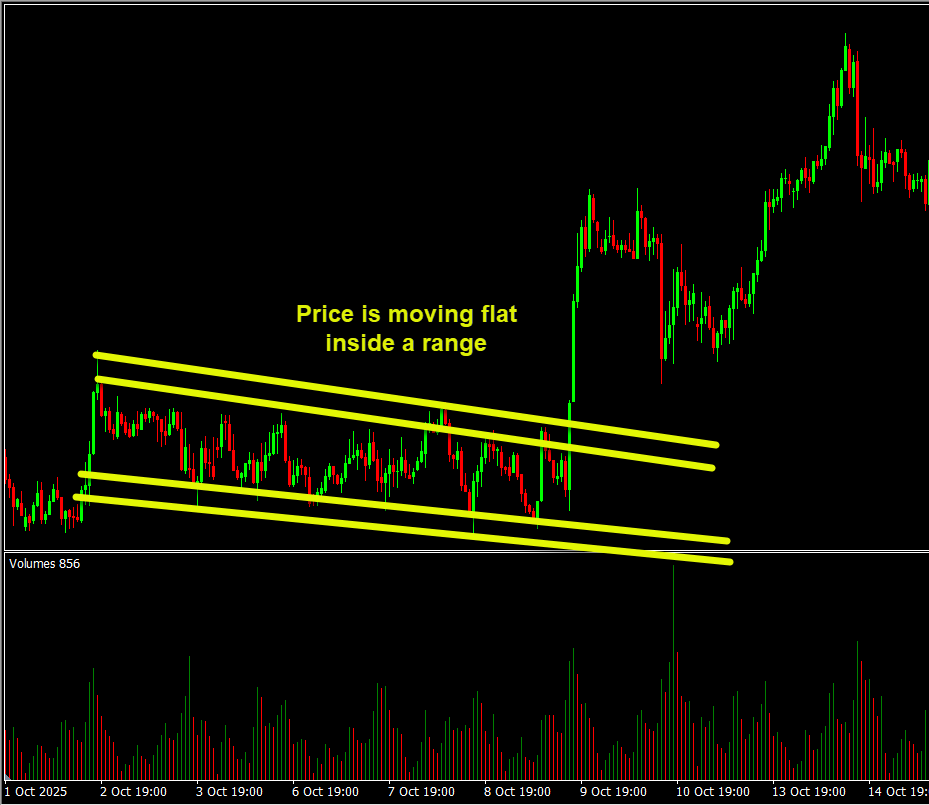
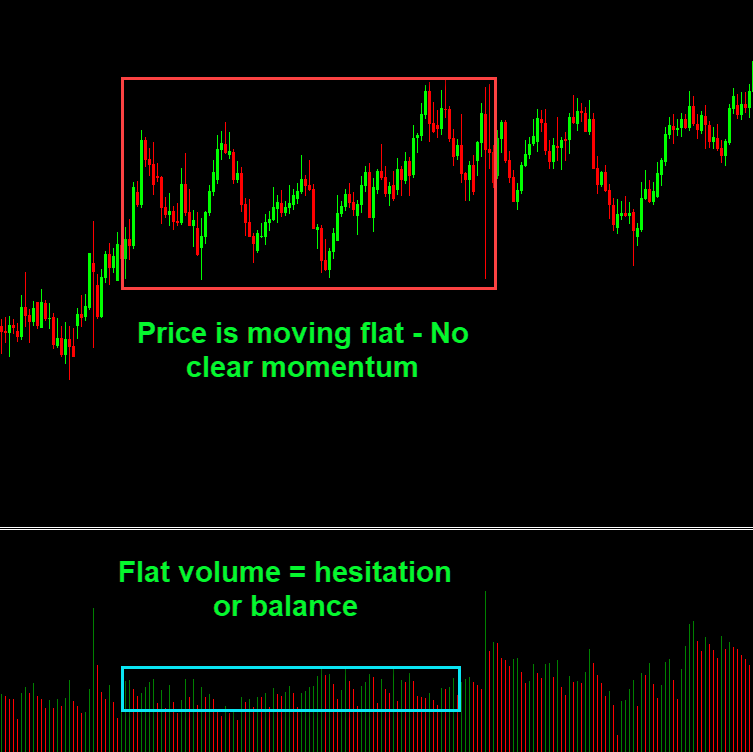 • Falling volume = fading commitment • Flat volume = hesitation or balance
A move without participation is fragile. A move with participation has weight.
• Falling volume = fading commitment • Flat volume = hesitation or balance
A move without participation is fragile. A move with participation has weight.
 This is rejection , not continuation.
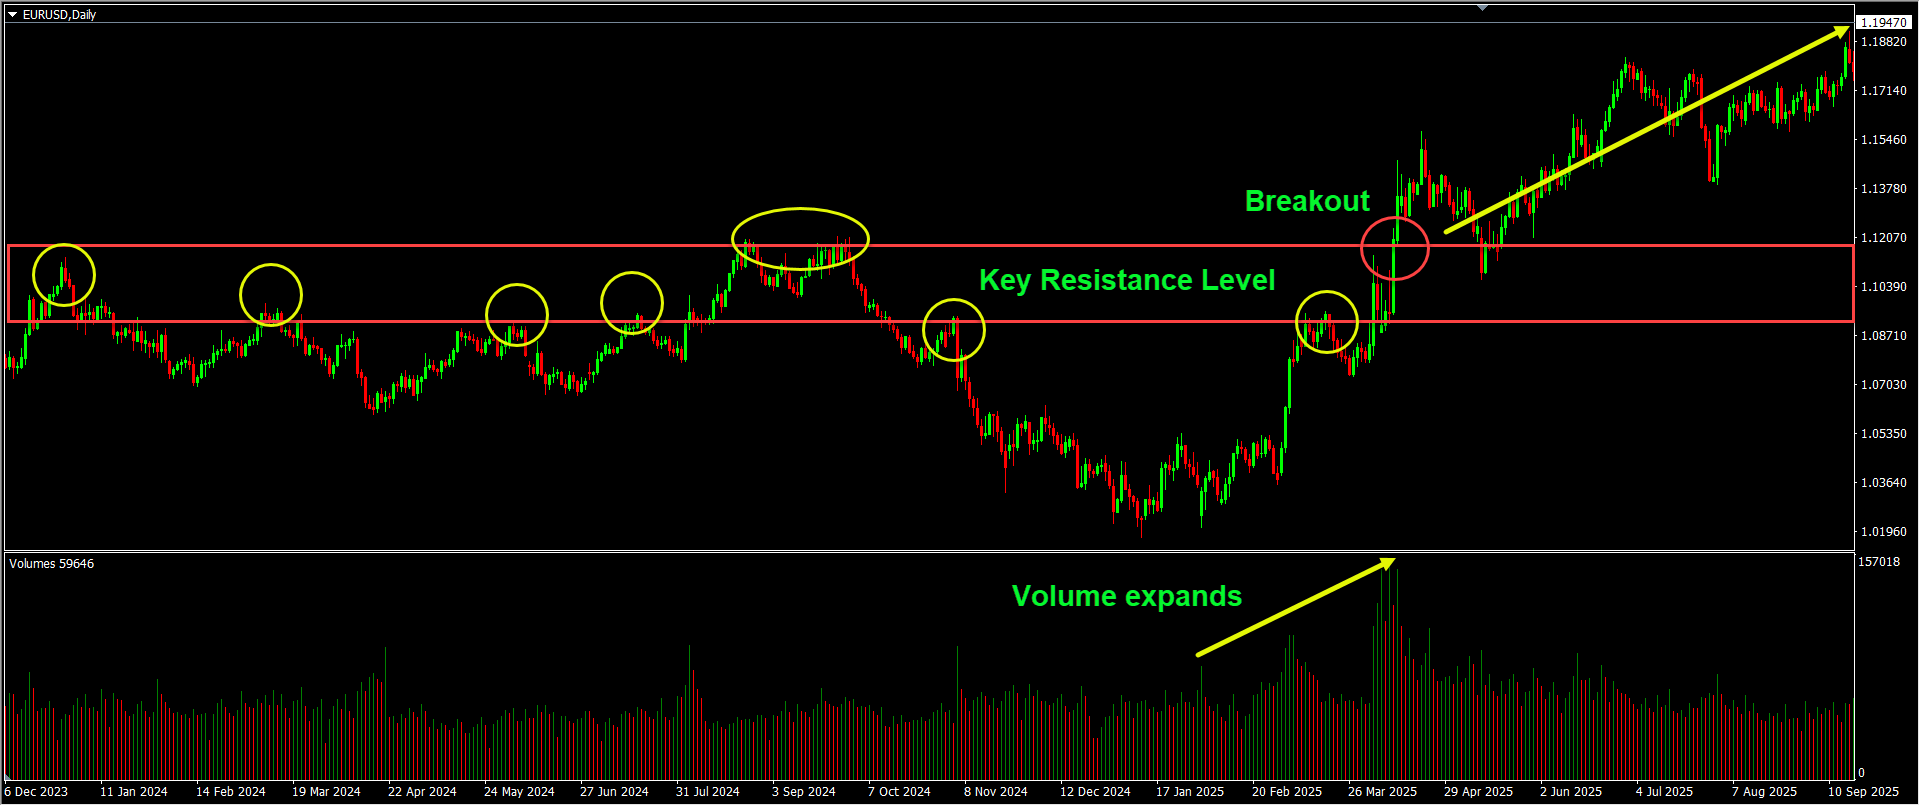
 This is acceptance .
Volume tells you which scenario you are seeing — before the move fully plays out.
This is acceptance .
Volume tells you which scenario you are seeing — before the move fully plays out.
 If price pushes higher or lower, but volume fails to confirm, the move may be weakening.
This doesn’t mean immediate reversal — it means be cautious .
If price pushes higher or lower, but volume fails to confirm, the move may be weakening.
This doesn’t mean immediate reversal — it means be cautious .
 • Candle size compared to recent history • Speed of price movement
 • Trend line breakouts with price closing below / above the trend lines and holding there – • Range Breakout
• Sudden spikes → reaction, not always continuation
• Trend line breakouts with price closing below / above the trend lines and holding there – • Range Breakout
• Sudden spikes → reaction, not always continuation
 Volatility tells you when the market is awake .
- Volume – participation (buyers and sellers)
- Volatility – intensity
Is this move supported by real evidence, or is it just noise?
Why Price Alone Is Not (always) Enough
Price movement is the result of trading decisions — not the cause. A candle can move:- Because thousands of traders made their trades and caused the move
- Or because liquidity is thin
- Or because stops were triggered
- Or because volatility briefly spiked
- How much money is involved (bigger volumes = more money is in the market)
- How “aggressively” is the price moving
- Whether momentum is sustainable
Understanding Volume in Forex (The Right Way)
Unlike stocks, Forex has no centralized exchange. That means there is no specific, official volume number. Instead, traders use tick volume , which measures how frequently the price changes within a period. While it doesn’t show the exact traded money, it accurately reflects activity and participation . In practical terms, volume answers one question: Are traders actively involved at current market movement?How to Interpret Volume Behavior
• Rising volume = growing interest and participation
• Falling volume = fading commitment • Flat volume = hesitation or balance
A move without participation is fragile. A move with participation has weight.
Why Volume Confirms (or Rejects) Market Moves
Let’s look at a simple idea. When price pushes through an important level:- Support
- Resistance
- Range boundary
- Pattern structure
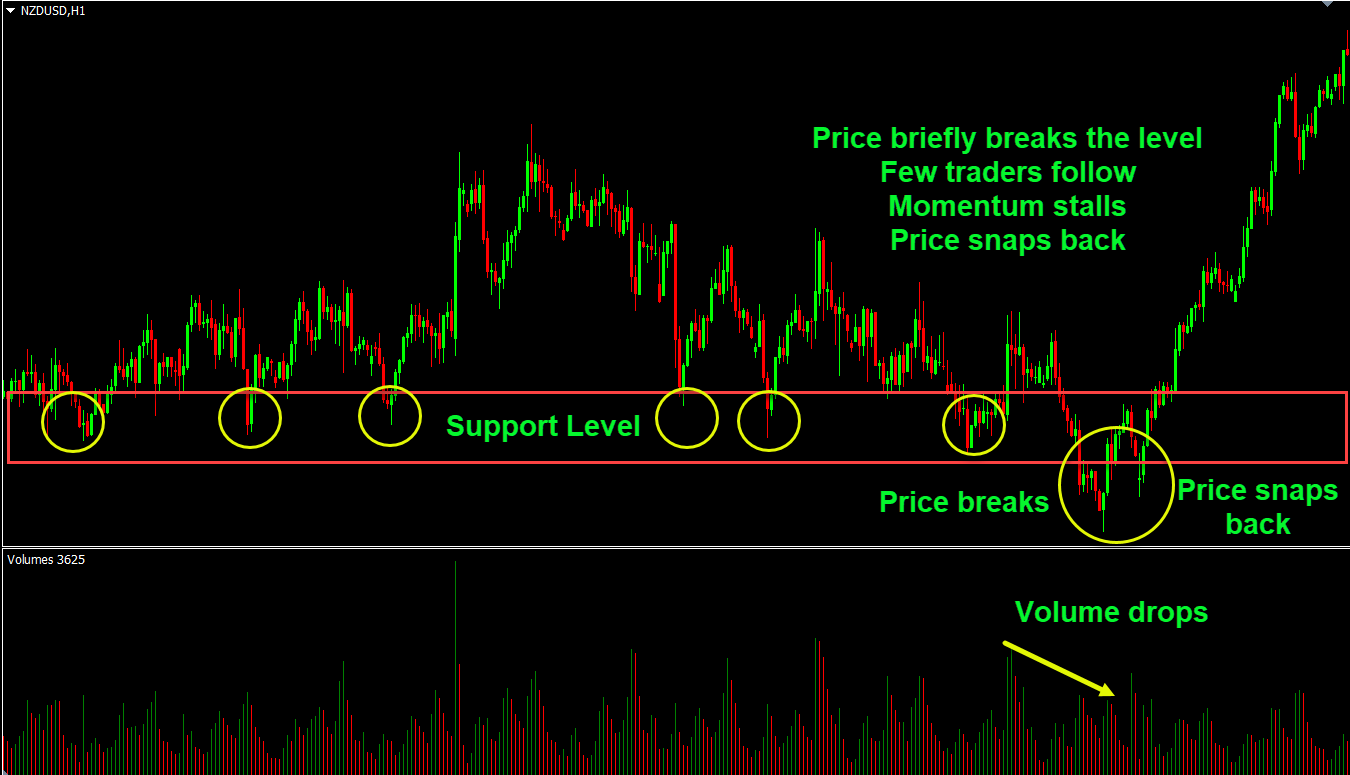
Scenario A — No Volume Support
Price briefly breaks the level Few traders follow Momentum stalls Price snaps back, and usually it ends up with a false breakout.
This is rejection , not continuation.
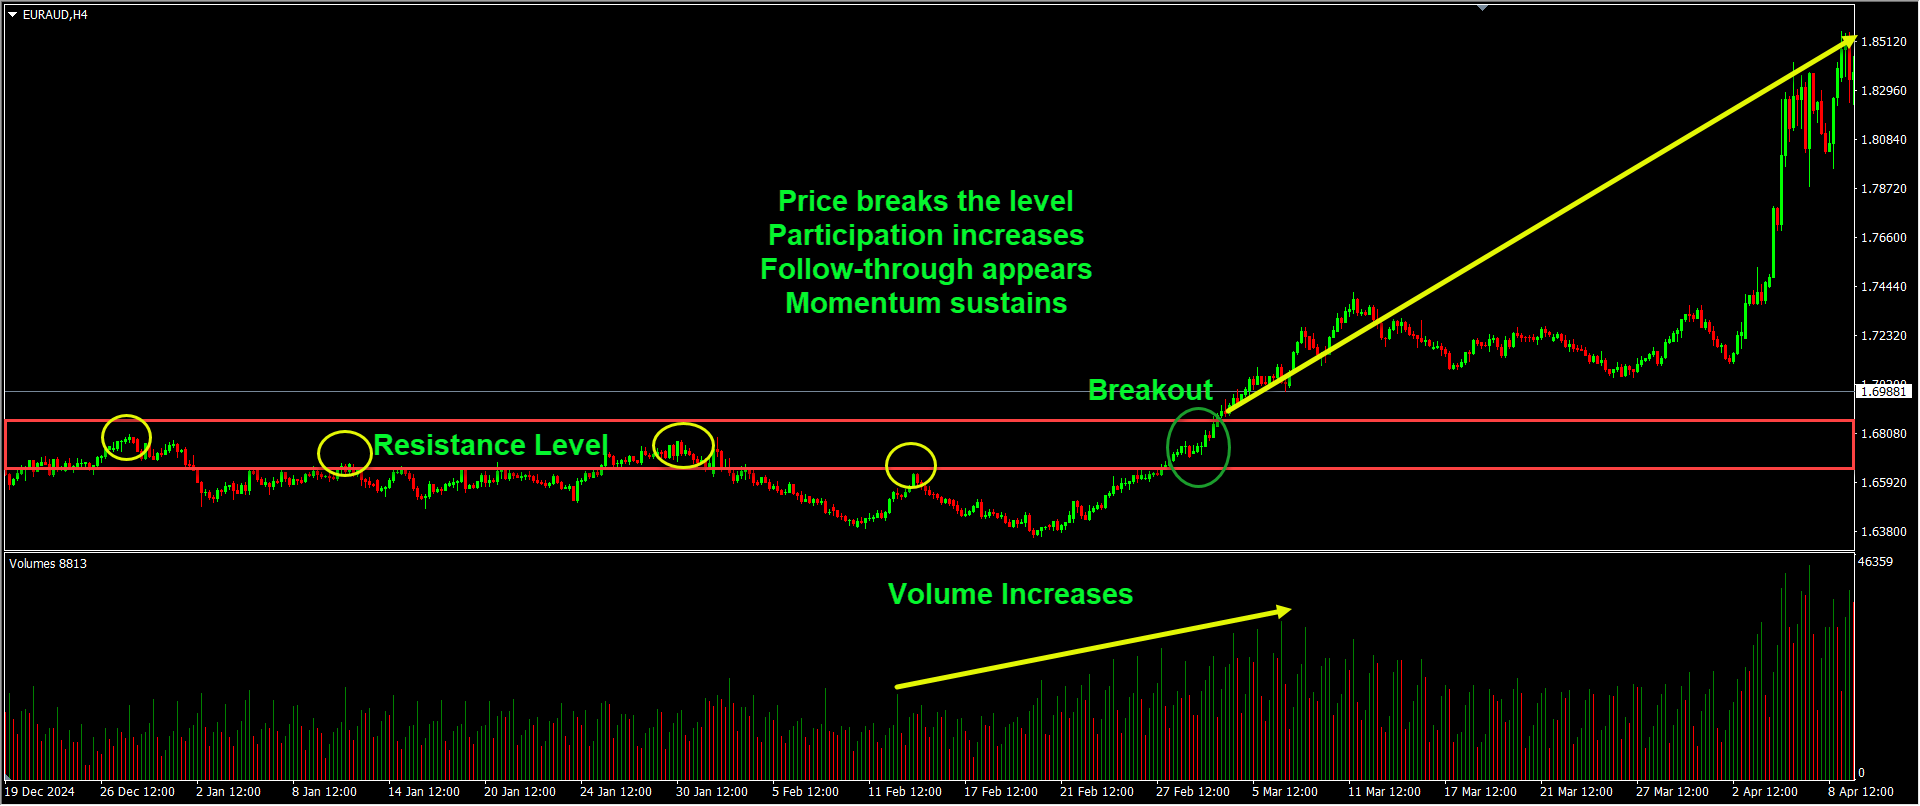
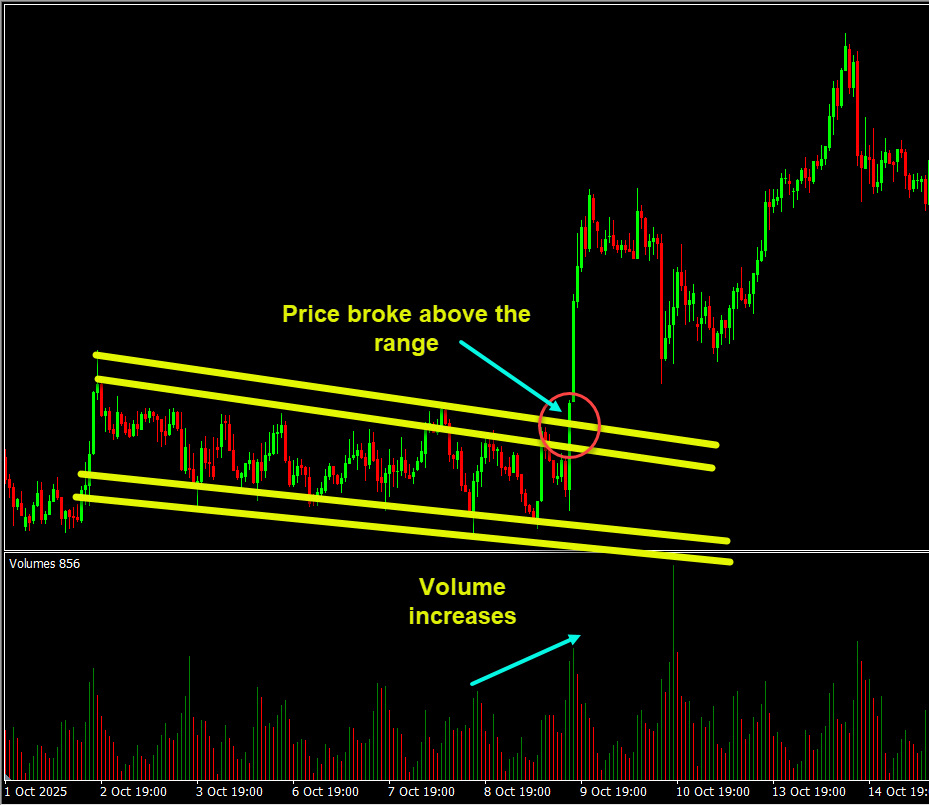
Scenario B — Strong Volume Support
Price breaks the level Participation increases Follow-through appears Momentum sustains
This is acceptance .
Volume tells you which scenario you are seeing — before the move fully plays out.
Common Volume Behaviors That Matter
1. Volume Expansion at Key Levels
When volume increases exactly where a decision is being made, it suggests commitment. This often appears:- After key level breakouts
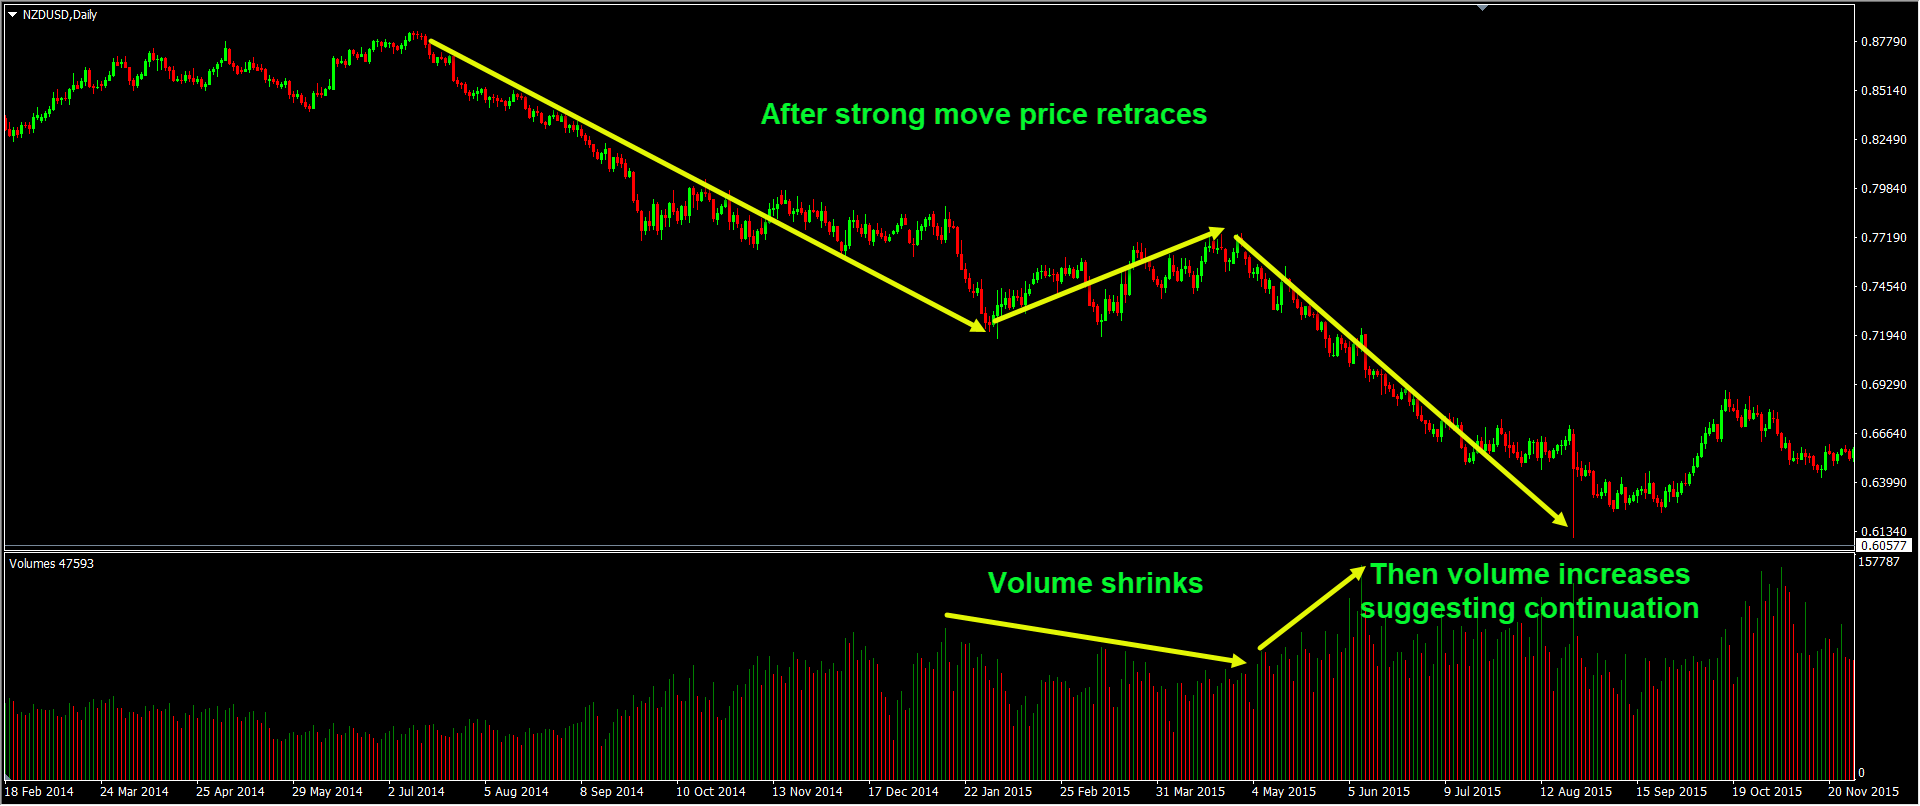
2. Low-Volume Pullbacks
After a strong move, price may retrace. If volume shrinks during the pullback, it usually means:- Profit-taking
- Temporary pause, to load the next trades
- Retraces – NOT a trend change
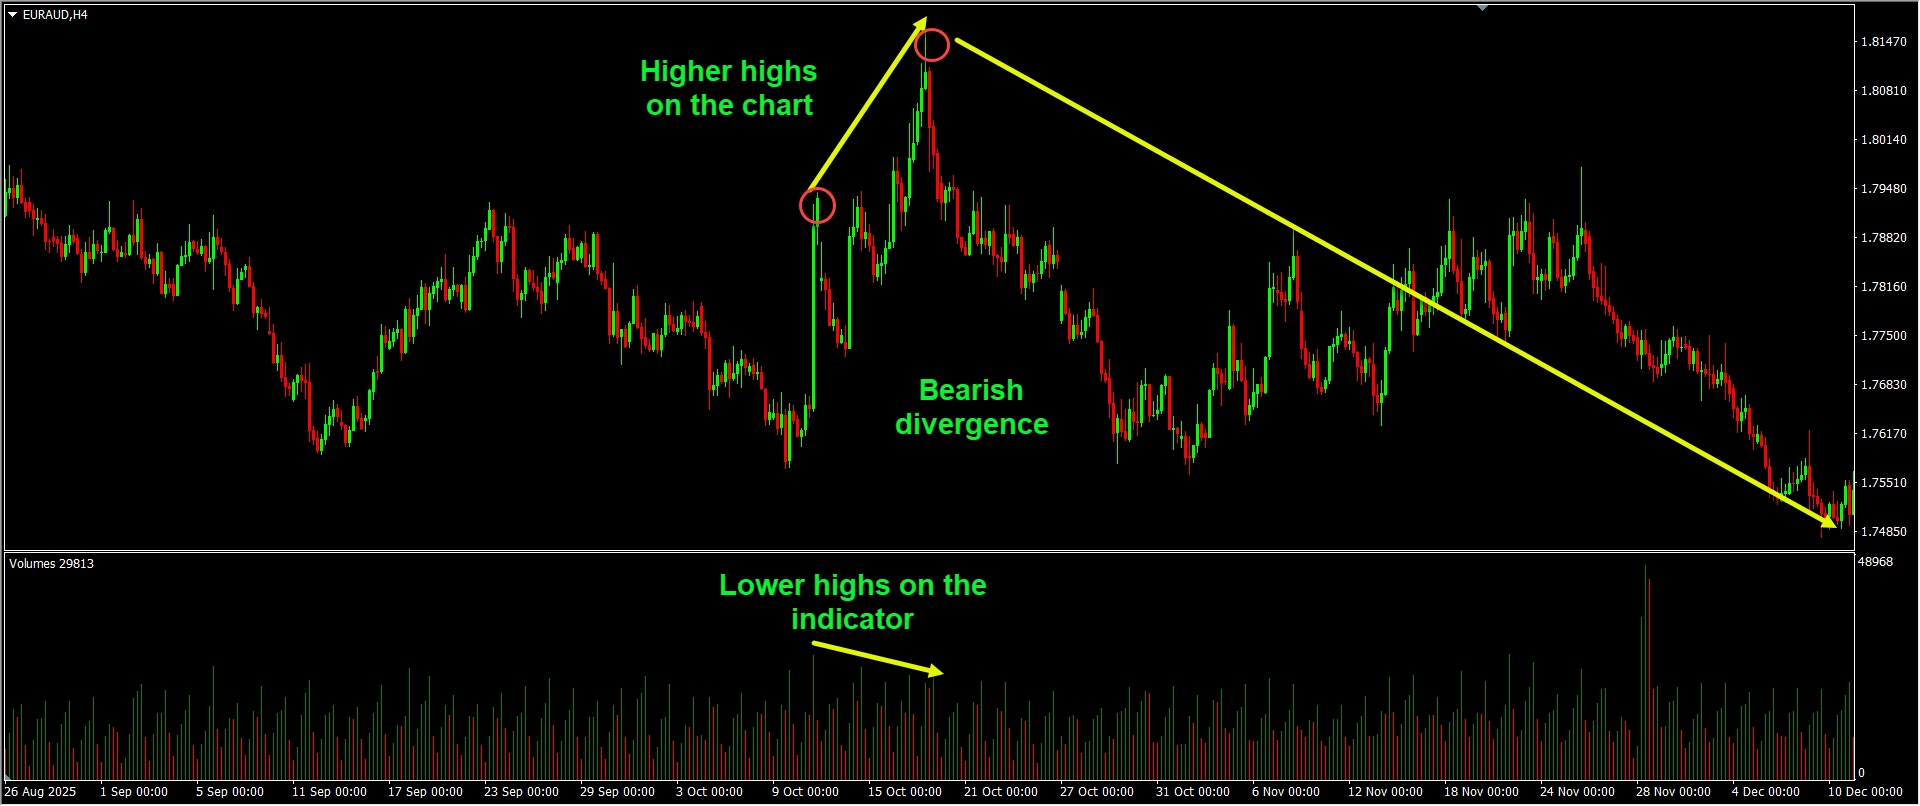
3. Volume Divergence
If price pushes higher or lower, but volume fails to confirm, the move may be weakening.
This doesn’t mean immediate reversal — it means be cautious .
What Volatility Really Tells You
Volatility is not direction. It is a sign of market movement . It shows:- How far is the price willing to travel
- How fast are decisions being made. Volatility reflects the speed of price changes
- Whether the market is calm or energized. Low volatility usually is a sign of a calm, often confident market. High volatility indicates an energized (or stressed in times) market, often driven by fear and sometimes uncertainty
- Active but slow
- Fast but thin
- Quiet and compressed
- Explosive and directional
Reading Volatility Without Overcomplication
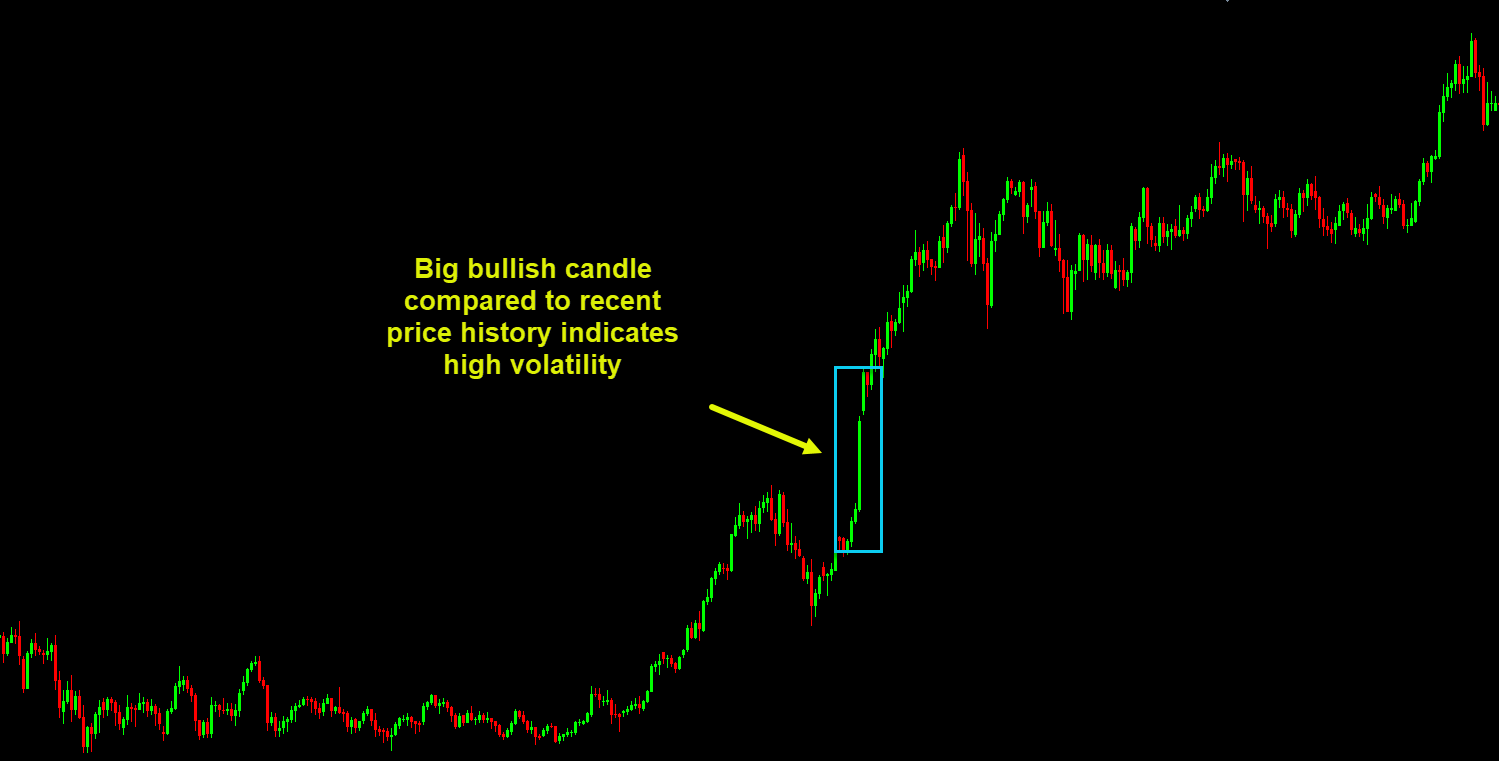
You don’t need advanced statistics. Simple observations are enough:
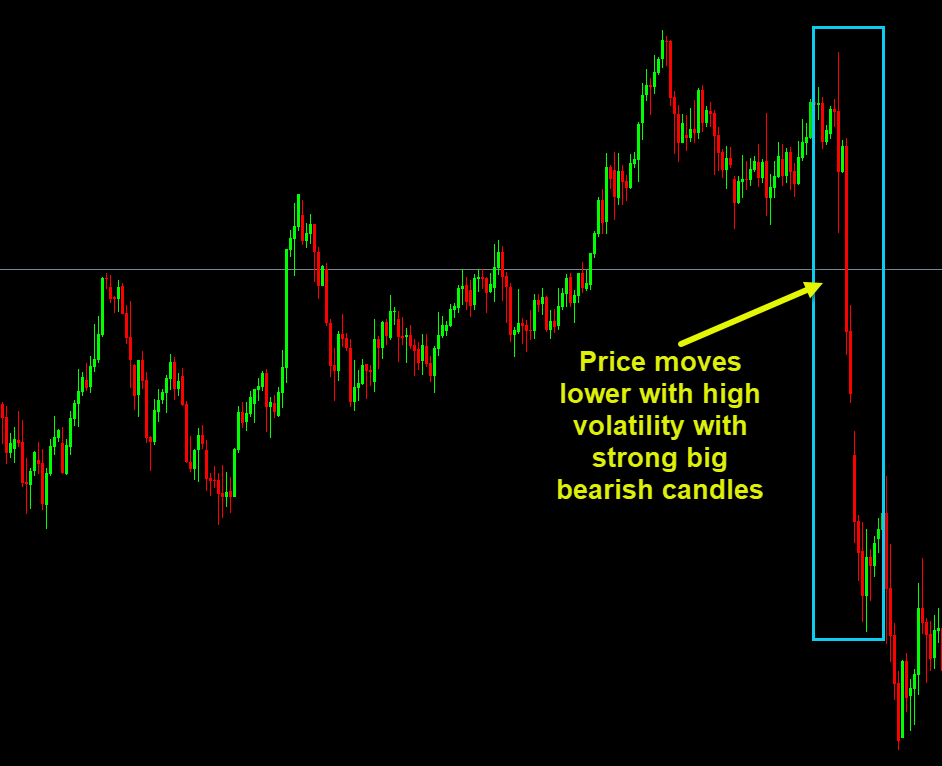
• Candle size compared to recent history • Speed of price movement
Volatility Behavior to Watch
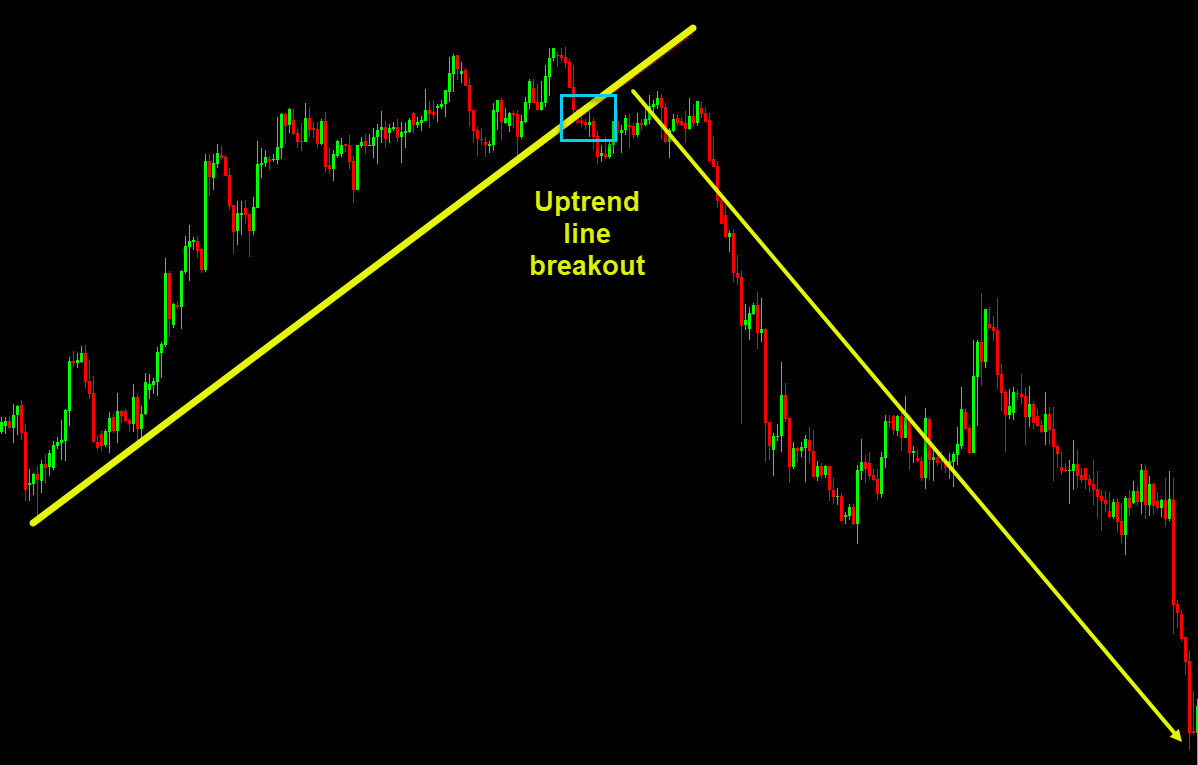
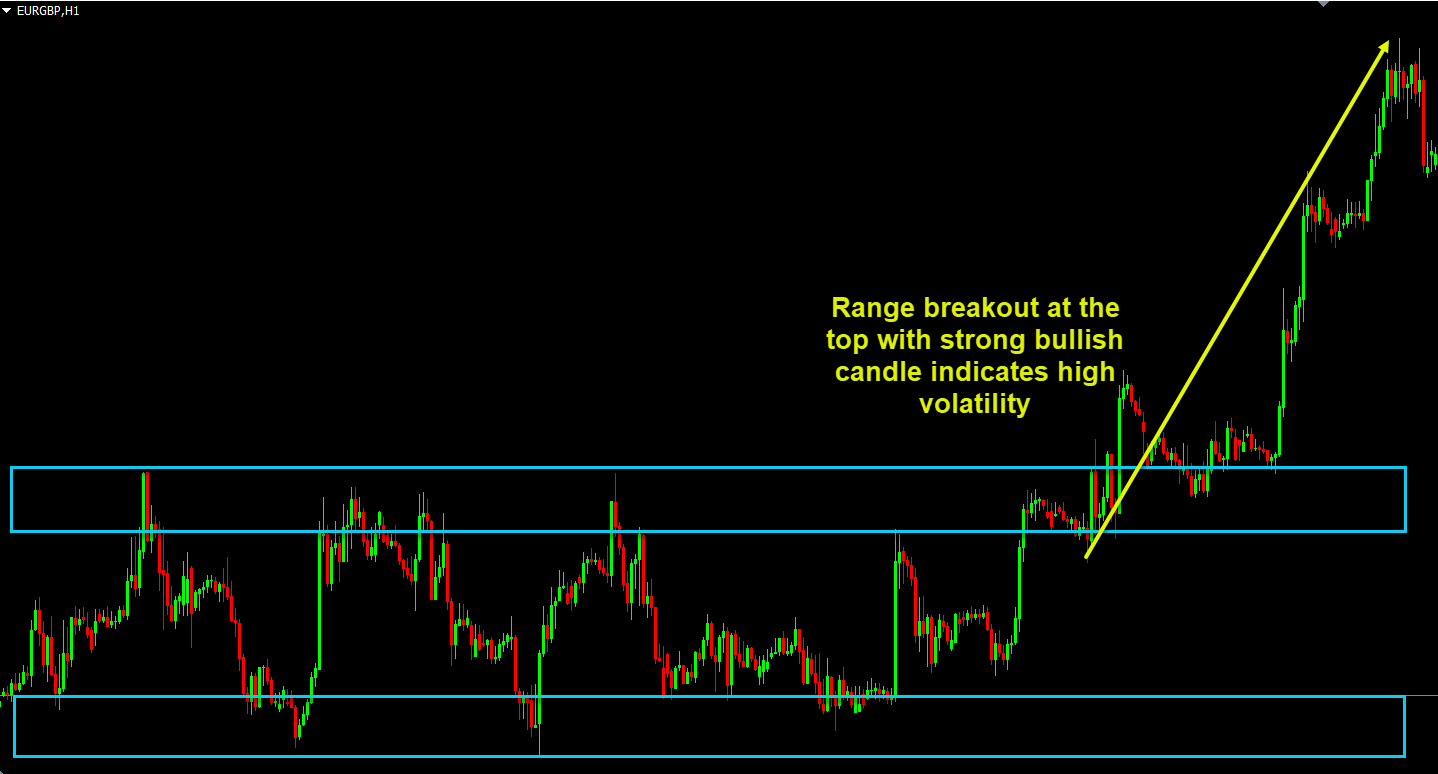
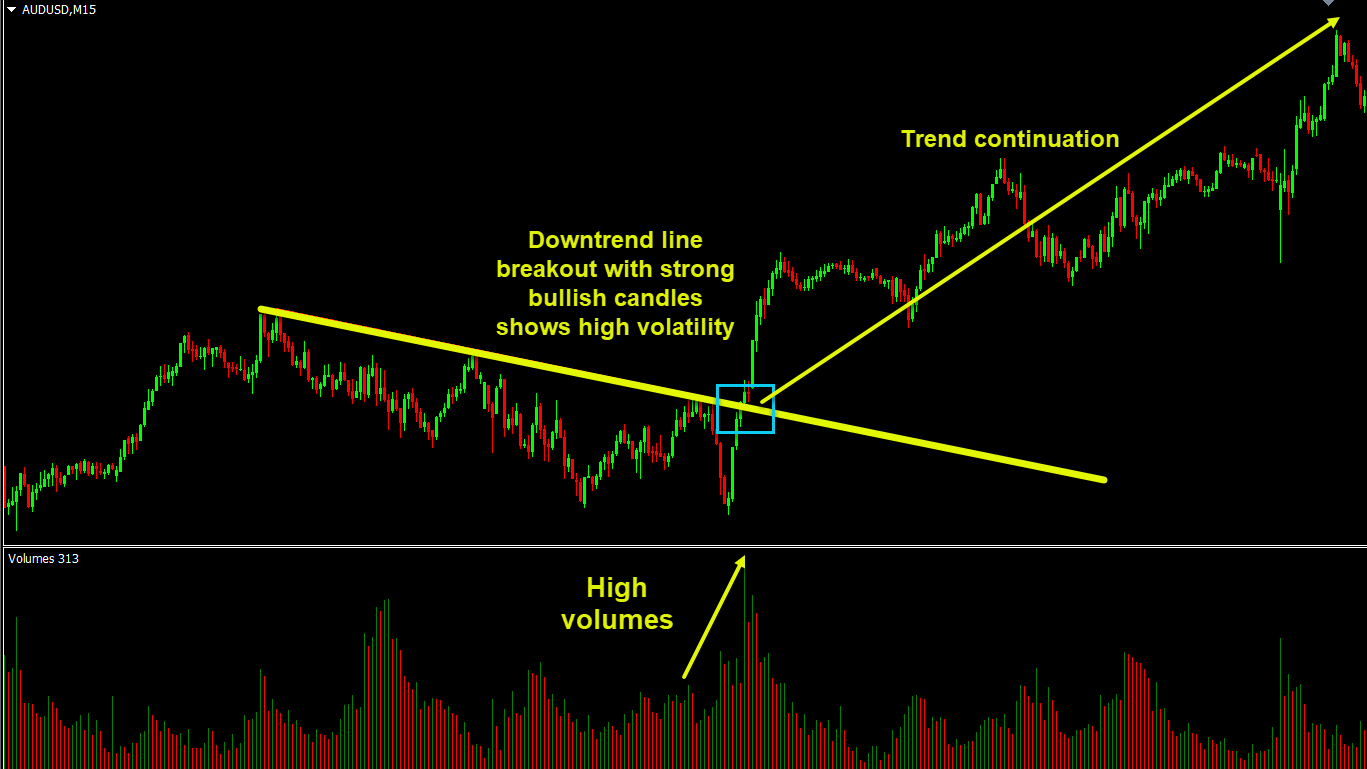
• Trend line breakouts with price closing below / above the trend lines and holding there – • Range Breakout
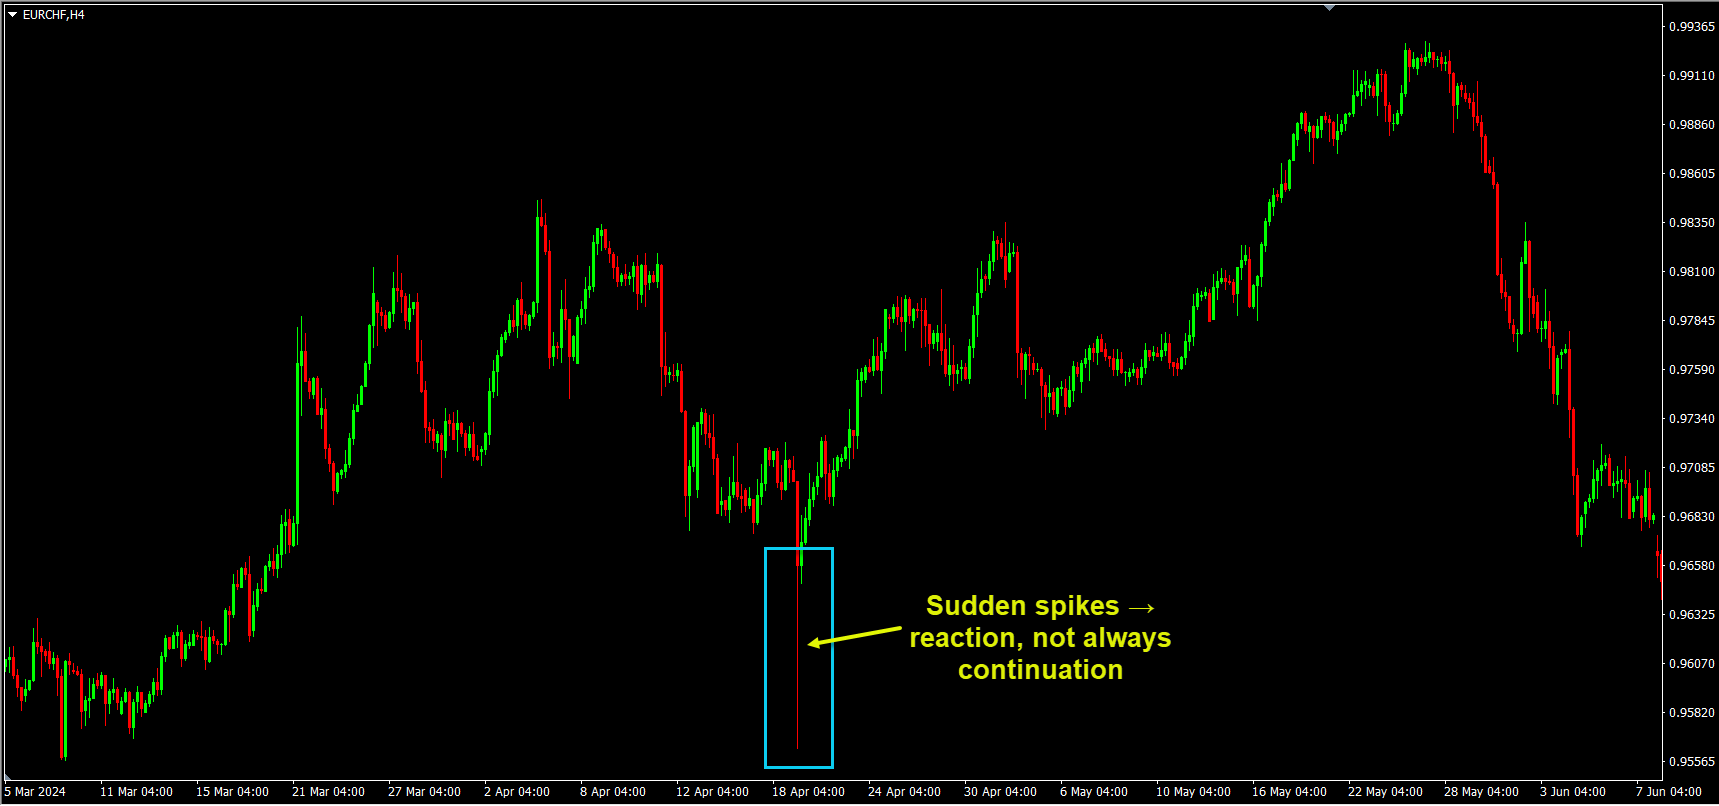
• Sudden spikes → reaction, not always continuation
Volatility tells you when the market is awake .
Why Volume and Volatility Must Be Used Together
On their own, each has limits. Together, they create clarity.High Volume + High Volatility
Participation is strong Movement is aggressive This usually supports:- Trend continuation
- Strong directional moves
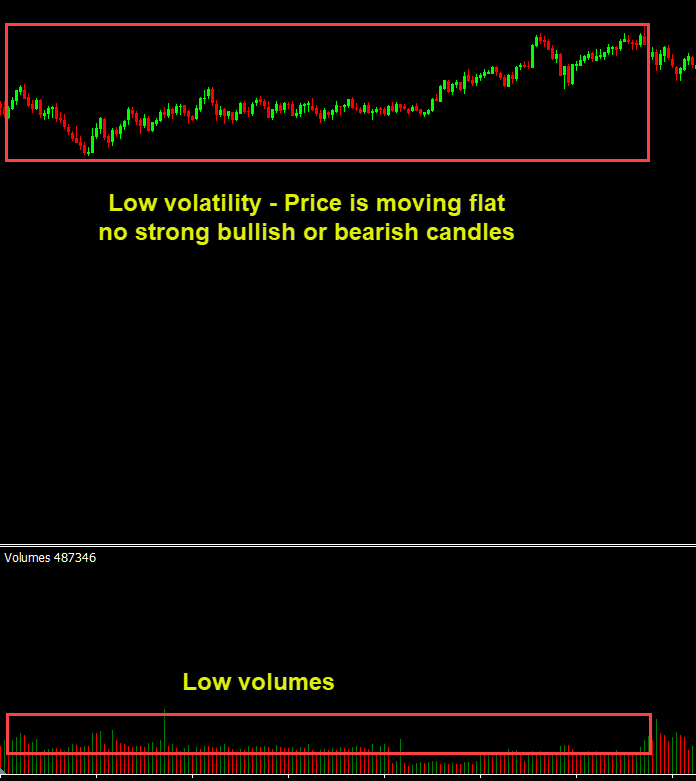
Low Volume + Low Volatility
Few traders involved Little movement This usually supports:- Range trading
- Mean reversion
- Patience over aggression
A Practical Confirmation Workflow
Here’s how to apply this in real trading:Step 1 — Start With Clean Price Structure
Identify:- Support and resistance
- Ranges
- Patterns
- Trend context
Step 2 — Observe Volume at Decision Points
Ask:- Check Volumes indicator
- Whether volumes are increasing or decreasing?
Step 3 — Evaluate Volatility
Ask:- Do we have strong bullish candles after breakout showing high volatility?
Step 4 — Combine the Evidence
Only act when:- Price breaks structure
- Volume confirms acceptance
- Volatility supports continuation
Step 5 — Adapt Risk to Volatility
Volatility should guide how to:- Stop placement
- Position size
- Profit expectations
Common Errors Traders Make
Trading Speed Instead of Participation
A fast price movement without confirmed volume is much less reliable.Treating Big Candles as Strength
Large candles alone don’t equal commitment.Using Indicators Without Context
Indicators should confirm price — not replace it.Final Perspective: Confirmation Is Discipline
Most trading losses don’t come from bad strategies. They come from acting before the market confirms . Volume and volatility don’t predict the future. They validate the present . When you learn to wait for:- Participation
- Energy
- Acceptance