1. Why Patterns Matter
In the world of Forex, prices don’t just move randomly. It often moves in
repeating structures, as the collective psychology of market participants shows up visually on the chart. Recognizing those structures gives you two big advantages:
- Early warning of a potential move (so you can prepare, not react).
- Defined risk and reward because good patterns allow you to structure your trade (entry, stop, target) more clearly.In this article, we’ll focus on three cornerstone patterns: Head & Shoulders, Triangles, and Wedges — what they are, why they form, and what to watch out for.
2. Pattern #1: Head & Shoulders
What it looks like
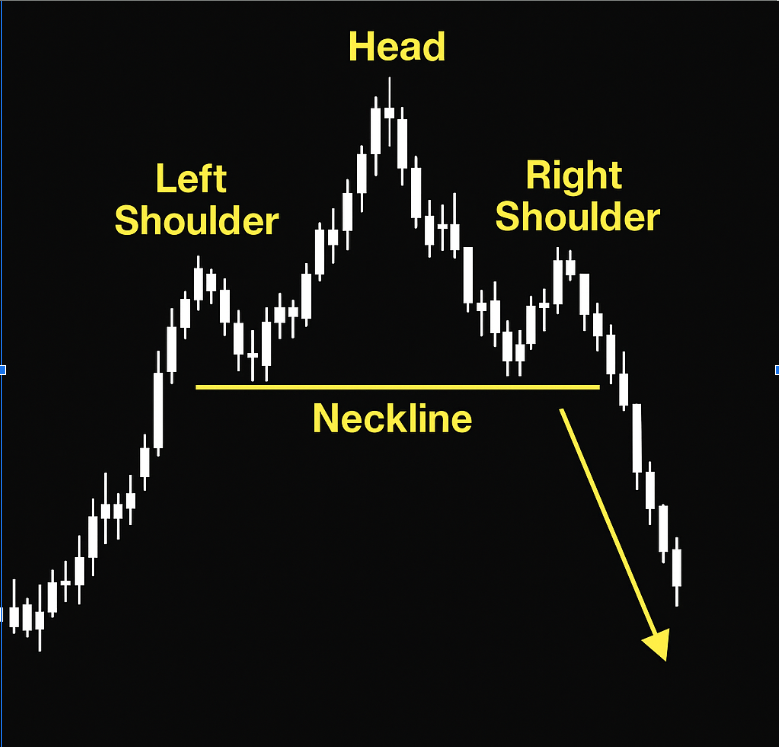
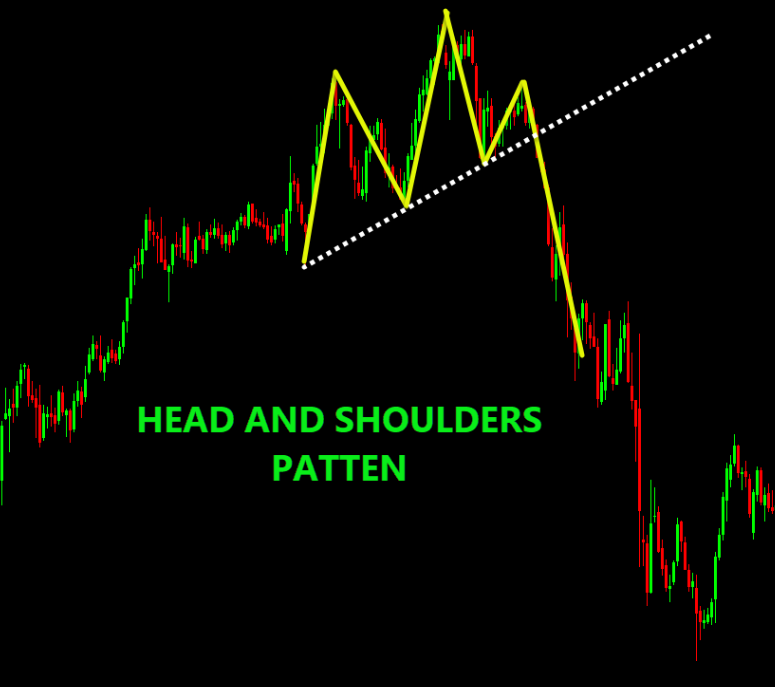
- In an uptrend, a Head & Shoulders (H&S) formation is a peak (left shoulder), then a higher peak (head), then another peak at approximately the level of the first (right shoulder). Underneath these three peaks is a “neckline” which links the lows between the shoulders and the head.
- Once the price breaks below the neckline, the H&S completes and often signals a trend reversal from up → down.
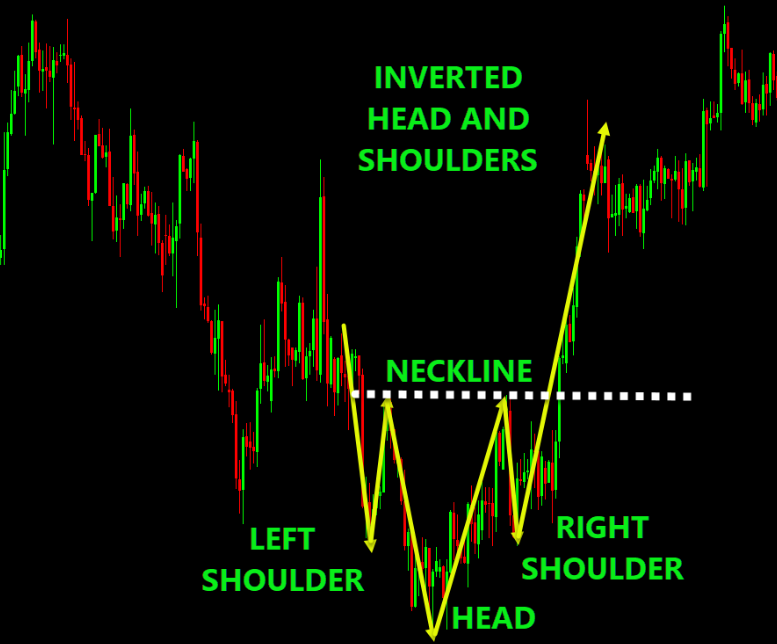
- In a downtrend, the mirror image is the Inverse Head & Shoulders: left shoulder (low), head (lower low), right shoulder (low roughly like first), neckline above, break of neckline signals reversal down → up.
Why it forms
- The left shoulder and head form as buyers push higher (in an uptrend) until exhaustion. The market tests a new high (head) but fails to sustain it.
- The right shoulder is a weaker attempt to re-test the high; it fails, meaning buyers are tired / sellers are stepping in.
- The neckline break is the trigger: the structure of the trend is broken, and the price often accelerates in the opposite direction.
Pitfalls & tips
- The shoulders must be at roughly similar levels; if the right shoulder is much higher, the pattern is weak. Note, the right shoulder can be lower than the left shoulder; the main idea is that the right shoulder shows exhaustion of the market
- Volume matters: ideally, volume drops during formation and increases on the break.
- Beware of fake breaks: price may break the neckline, then revert. Use confirmation or a smaller size.
- Timeframe matters: A small H&S on a low timeframe may be less reliable than one on H1, H4 or Daily.
3. Pattern #2: Triangles
Triangles are among the most reliable and visible continuation or reversal patterns in Forex. There are three main types:
Ascending,
Descending, and
Symmetrical.
What they look like
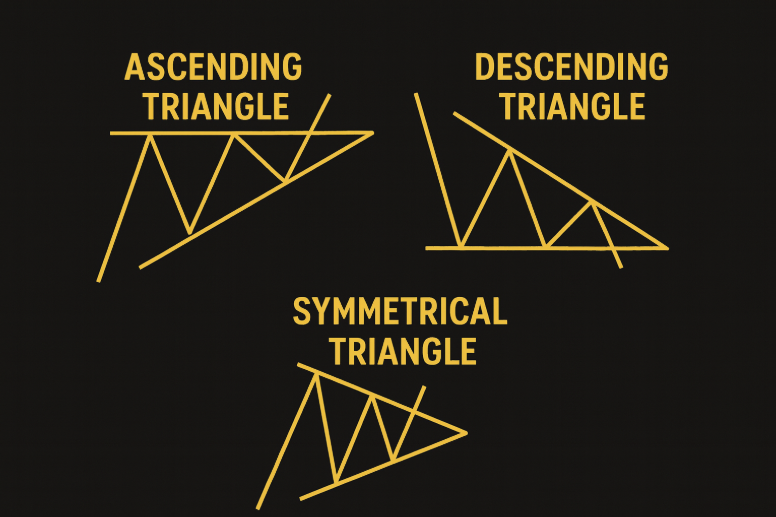
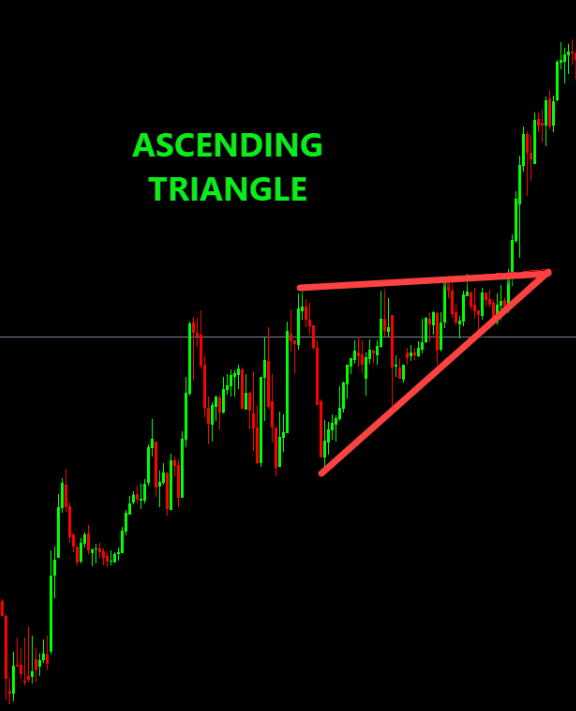
- Ascending Triangle: A flat or almost flat (horizontal) resistance line on top + rising support trendline underneath. Buyers push higher lows, sellers stand at the same resistance level.
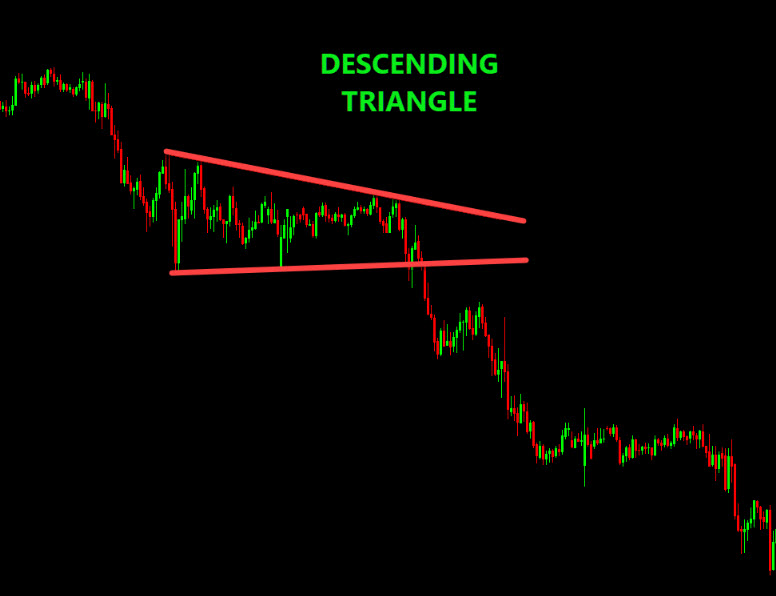
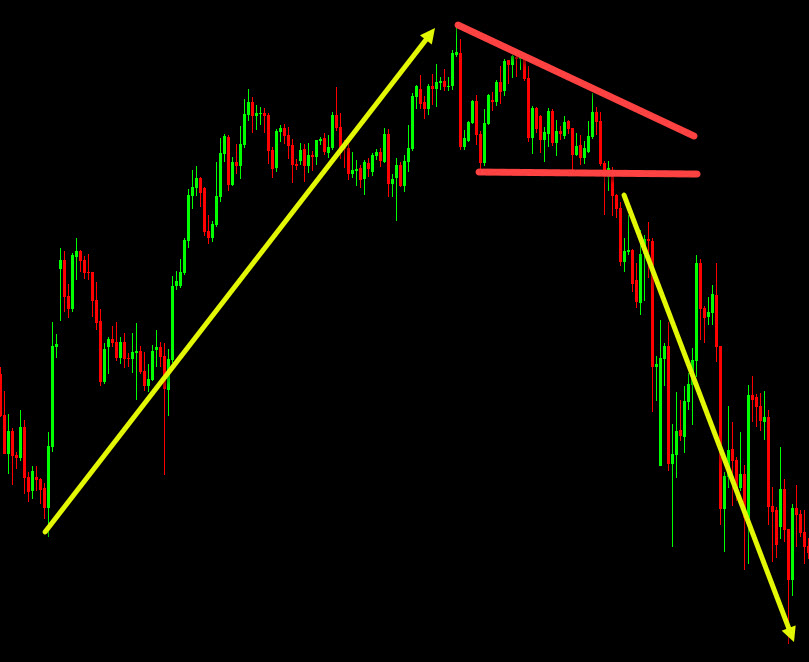
- Descending Triangle: A flat (horizontal) support line on the bottom + descending resistance trendline above. Sellers push lower highs, and buyers stand at a constant support.
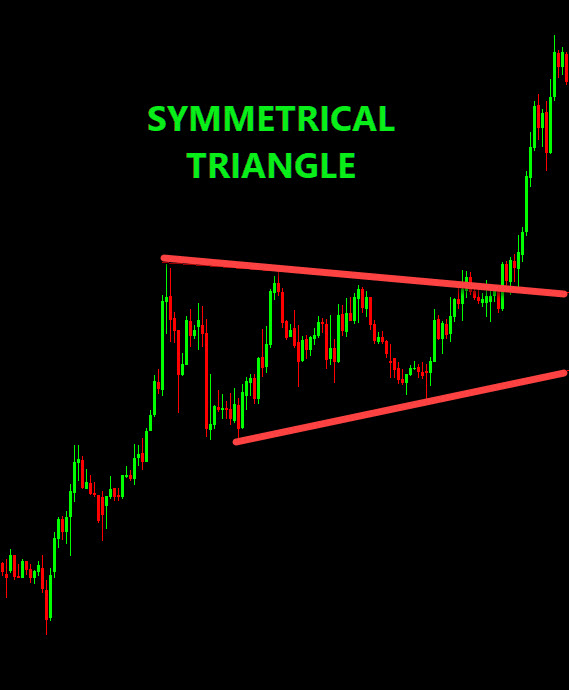
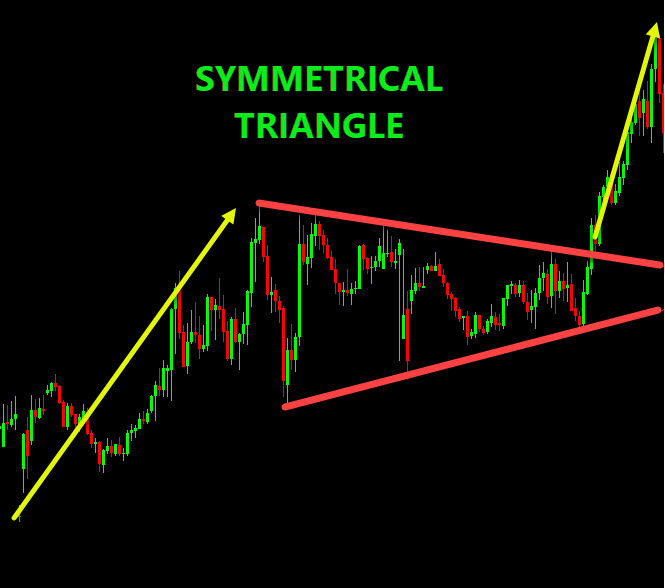
- Symmetrical Triangle: Two converging trendlines (one downward from above, one upward from below). Price compresses into the narrow tip.
Why they form
Think of them as
market indecision gradually squeezing:
- Buyers and sellers are in a tug of war; the range tightens as pressure builds.
- Suppliers/resistance hold on top (Ascending), or buyers/support on bottom (Descending), or both sides converge (Symmetrical).
- Eventually, the pressure breaks on one side → strong movement.
Continuation vs Reversal
- Symmetrical triangles often continue the prior trend — e.g., if you’re in an uptrend, a symmetrical triangle tends to break higher.
- Descending triangles (in an uptrend) may signal a reversal (break support) as well. Context is key: look at the trend and other signs beforehand
Pitfalls & tips
- False breakouts are common in triangles, especially when the breakout lacks volume or during low-liquidity sessions.
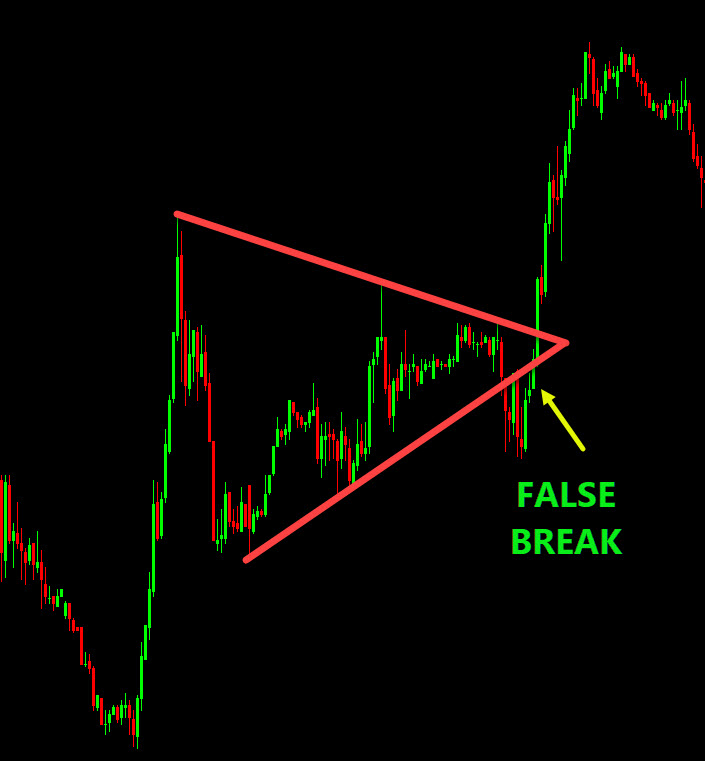
- Beware of “failed pattern”: The breakout occurs, you enter, but the price reverses and goes back into the triangle. Manage your risk smartly.
- Larger time-frames = stronger patterns. A small triangle on M15 will usually be less reliable than H4.
- Align breakout direction with broader trend or key levels for higher probability.
4. Pattern #3: Wedges
Wedges are similar to triangles in appearance (converging trendlines), but with a distinct
directional bias and slope. There are two kinds:
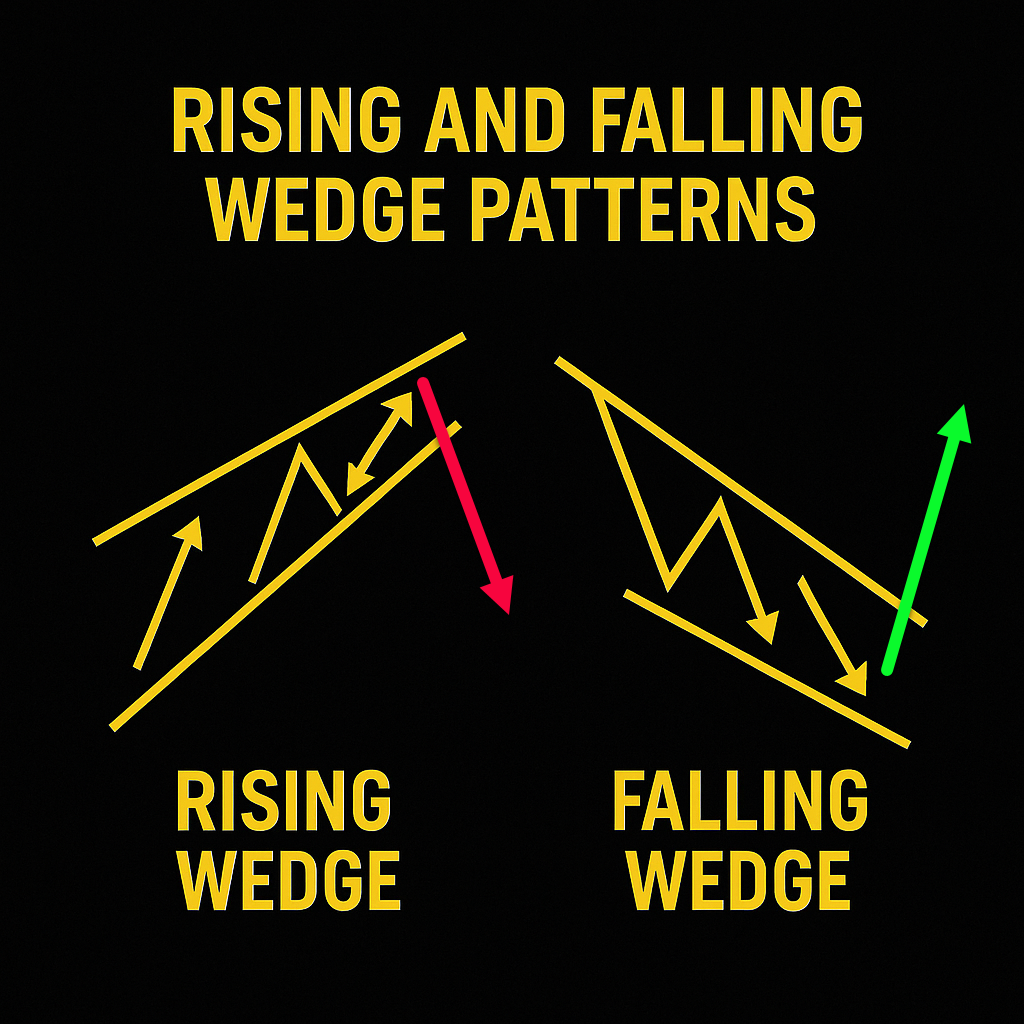
Rising Wedge (bearish bias) and
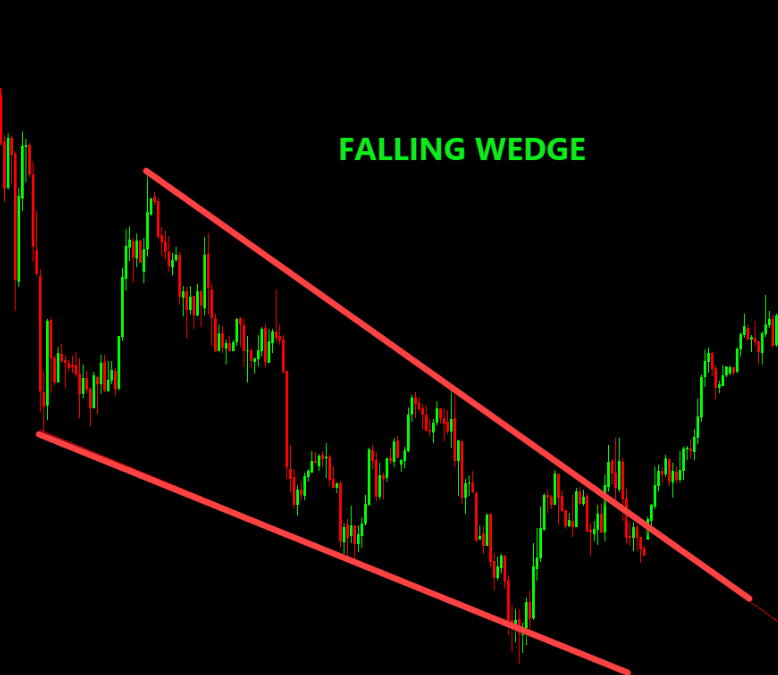
Falling Wedge (bullish bias).
What they look like
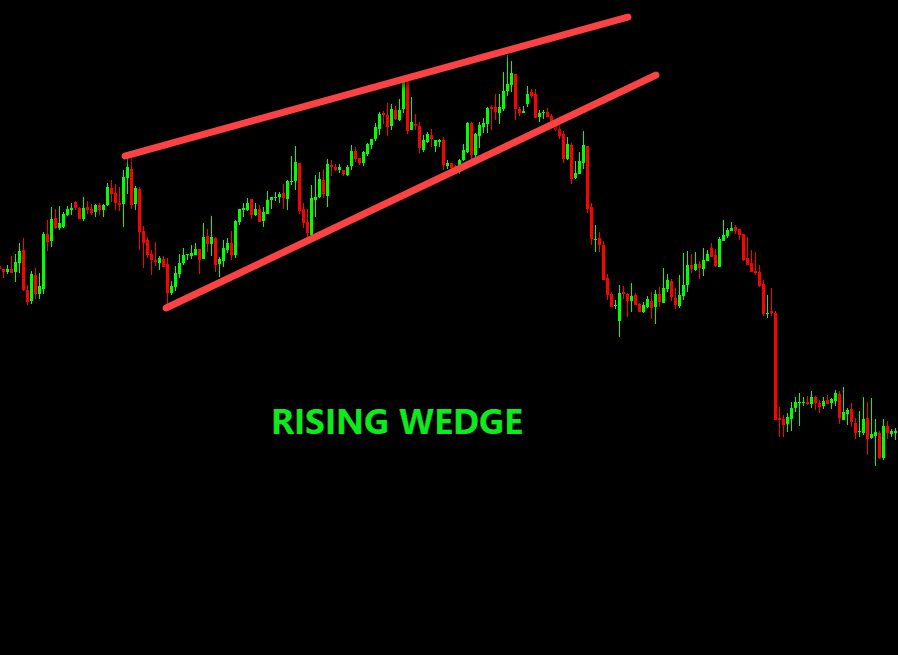
- Rising Wedge: Trendlines both sloping upward, but the upper line rises more gradually while the lower line rises more steeply, so the space narrows. Price is making higher highs and higher lows, but the pace of lows is steeper.
- Falling Wedge: The opposite: two downward-sloping lines, the lower line falling more slowly than the upper, so the wedge narrows on the downside.
Why they form
- In a rising wedge (within an uptrend or following one), buyers continue to push the price up, but the acceleration is weakening — each high is not much higher, and each low climbs more rapidly → a signal of weakening momentum.
- In a falling wedge, sellers push the price down, but momentum is fading — the lower lows are at a slower pace.
- The wedge is thus a compression of momentum. The breakout tends to be against the direction of the wedge’s slope (for rising wedge → break down; falling wedge → break up).
Pitfalls & tips
- Wedges are trickier than triangles because the slope gives false impression of continuation (especially a rising wedge after uptrend).
- Timing: Wedges tend to break later (as they consolidate more) — entering too early can mean sitting in a sideways market.
- Again, volume/momentum decline is key showing that the pattern is valid. If momentum remains strong in the direction of the wedge, it may not break as expected.
5. Putting It All Together: How to Use These Patterns in Your Trading Plan
Here’s how you can integrate these patterns into your trading routine:
Step A: Chart Scan & Pattern Identification
- On your chosen timeframe (e.g., H4, Daily), scan for the formations above.
- Draw key trendlines, necklines, and bases of triangles/wedges as you see them.
- Look at context: trend preceding the pattern, volume/momentum condition, market session.
Step B: Setting Rules for Entry, Stop, and Target
- For each pattern: define the entry trigger (break + optional retest), stop location (clear place beyond structure), and target method (height or width of pattern).
- Always compute risk vs reward for each setup. Aim for at least 1:2 R:R (risk – reward) where possible.
Step C: Confirmation & Filter
- Use momentum or volume (or price-action confirmation) to increase probability of your setups.
- Consider higher timeframe alignment: e.g., a triangle on H4 aligned with the slope on Daily makes the pattern stronger.
- If the market is in a low-liquidity time (holiday, end of session) be extra cautious.
Step D: Trade Execution & Management
- Once you’ve placed the trade, monitor how the price behaves around the breakout region.
- If the price comes back for a retest and fails, you may add or scale up; if price stalls or reverses, either tighten the stop or exit.
- Use trailing stop or partial profits in larger moves.
Step E: Review & Learn
- After the trade completes (hit target or stop out), review: Did the pattern work as expected? Was the context favourable? What could be improved?
- Over time, track which patterns in which conditions give you the best results (your edge).
6. Common Mistakes & How to Avoid Them
- Mistake 1: Seeing patterns everywhere (over-analysing). Keep it simple: Patterns must meet minimum structural rules (touches, symmetry, context).
- Mistake 2: Entering immediately on a breakout without confirmation. Sometimes, price breaks, then stalls or reverses.
- Mistake 3: Poor stop placement. If your stop is too wide relative to the pattern, you’re risking too much.
- Mistake 4: Ignoring trend/context. A triangle in a strong uptrend is more likely to break higher; a wedge forming mid-trend may not automatically reverse.
- Mistake 5: Not managing risk. Even “perfect” patterns can fail. Always limit risk and trade size accordingly.
- Mistake 6: Trading too many patterns at once. Focus on the best setups, not all setups.
7. Final Thoughts
Patterns like Head & Shoulders, Triangles and Wedges are among the most valuable tools in a Forex trader’s toolkit. They help you interpret
what the market structure is doing, not just what the price numerically is. When used carefully — with context, confirmation, risk control and discipline — they can give you an edge.
Here are the top five takeaways:
- Patterns exist because market psychology repeats.
- Structure matters: look for clear formation, touches, and context.
- Breakout + confirmation = better odds (vs blind entry).
- Always define your entry, stop and target before you trade.
- Trade patterns as part of a plan, not as hope-bets.
Stay patient. Keep practising pattern recognition and trade execution on demo, then live with a small size. With time, your eyes will spot high-quality structures, and you’ll build confidence in trading them.