Hello Trader! If you’ve ever stared at a chart and wondered, “Why did price suddenly turn around here?”, then you’re in the right place. In this article, I’ll walk you through supply and demand zones in the Forex market: What they are, why they matter, how to identify them, and how to use them wisely in your trading.
 By recognizing where demand or supply has previously dominated, you gain an advantage: you’re looking at where the market “took a side” before.
1. What are Supply & Demand Zones?
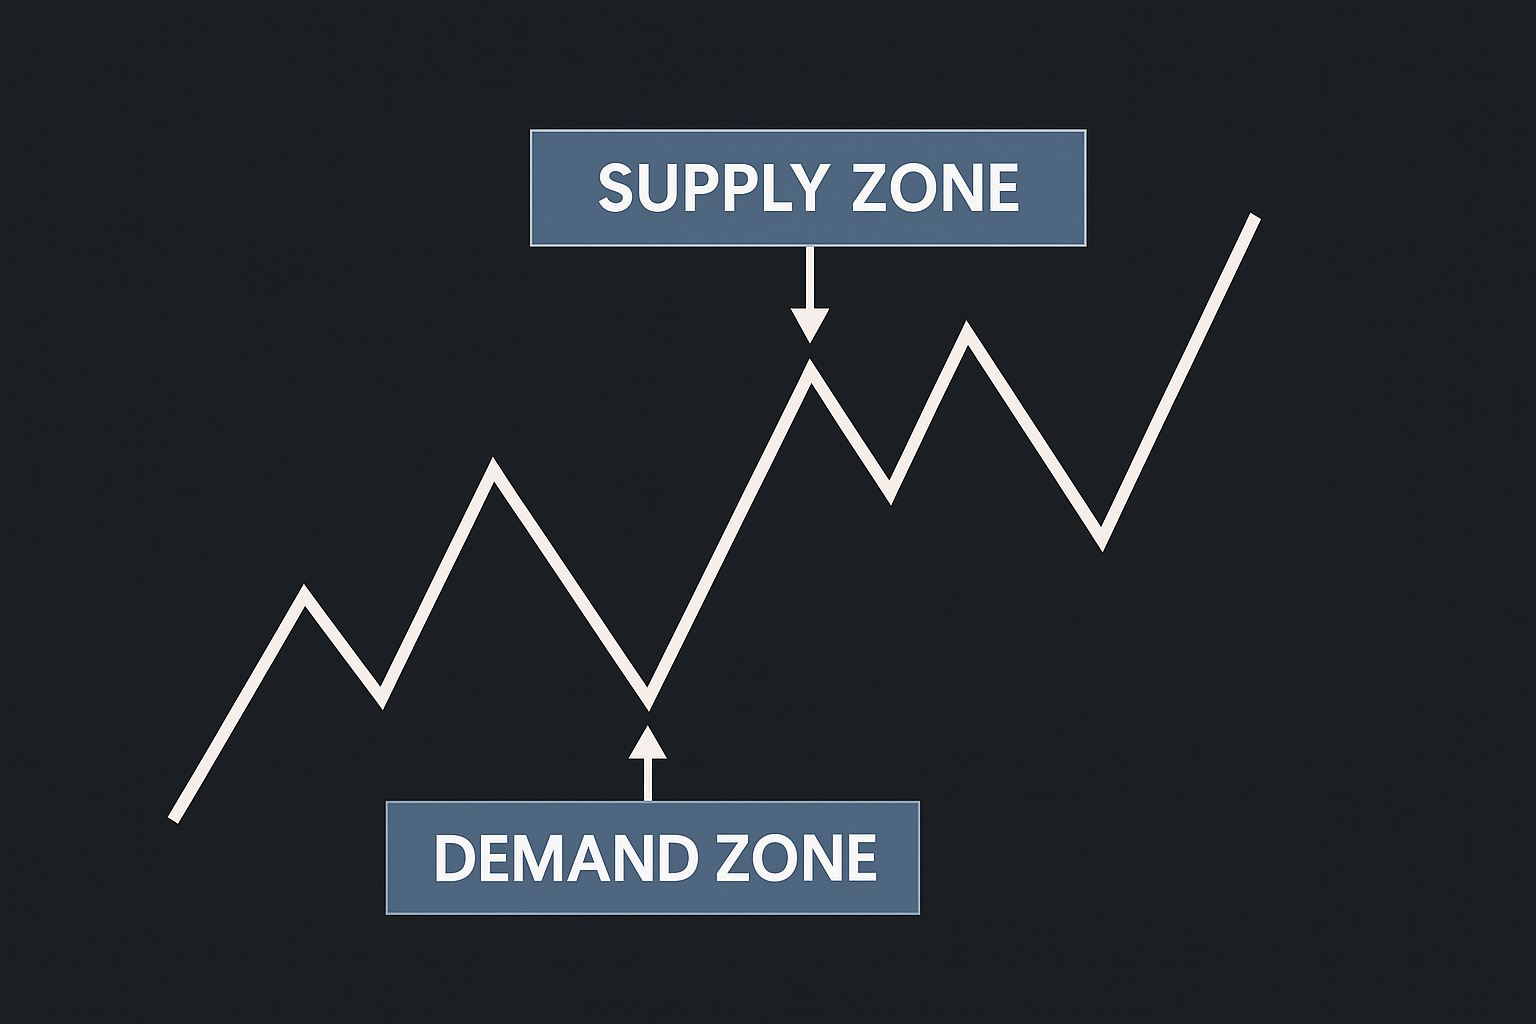
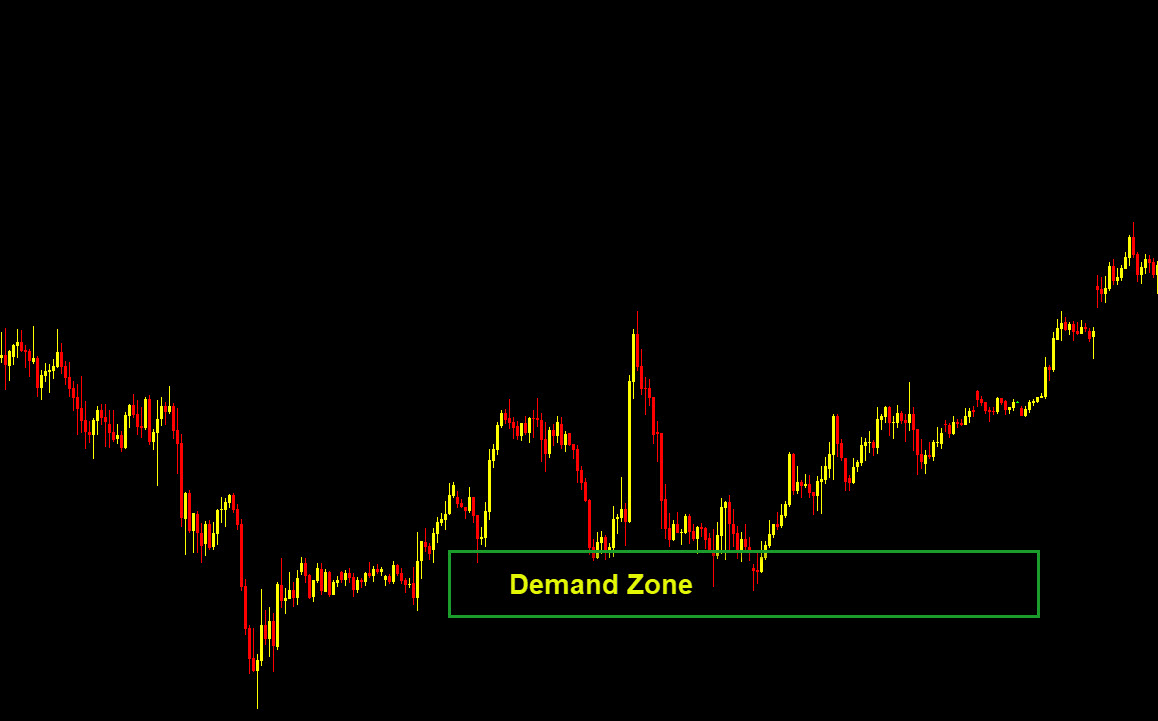
At heart, Forex moves because of two main forces: buyers and sellers. When one group overwhelms the other, the price moves. Supply & demand zones are areas on the chart where one side (buyers or sellers) has shown strong control in the past — and where that control may show up again.- A Demand Zone is a price area where buying interest was strong enough to push prices upward. Think this way: “buyers stepped in here and made the market go up”.
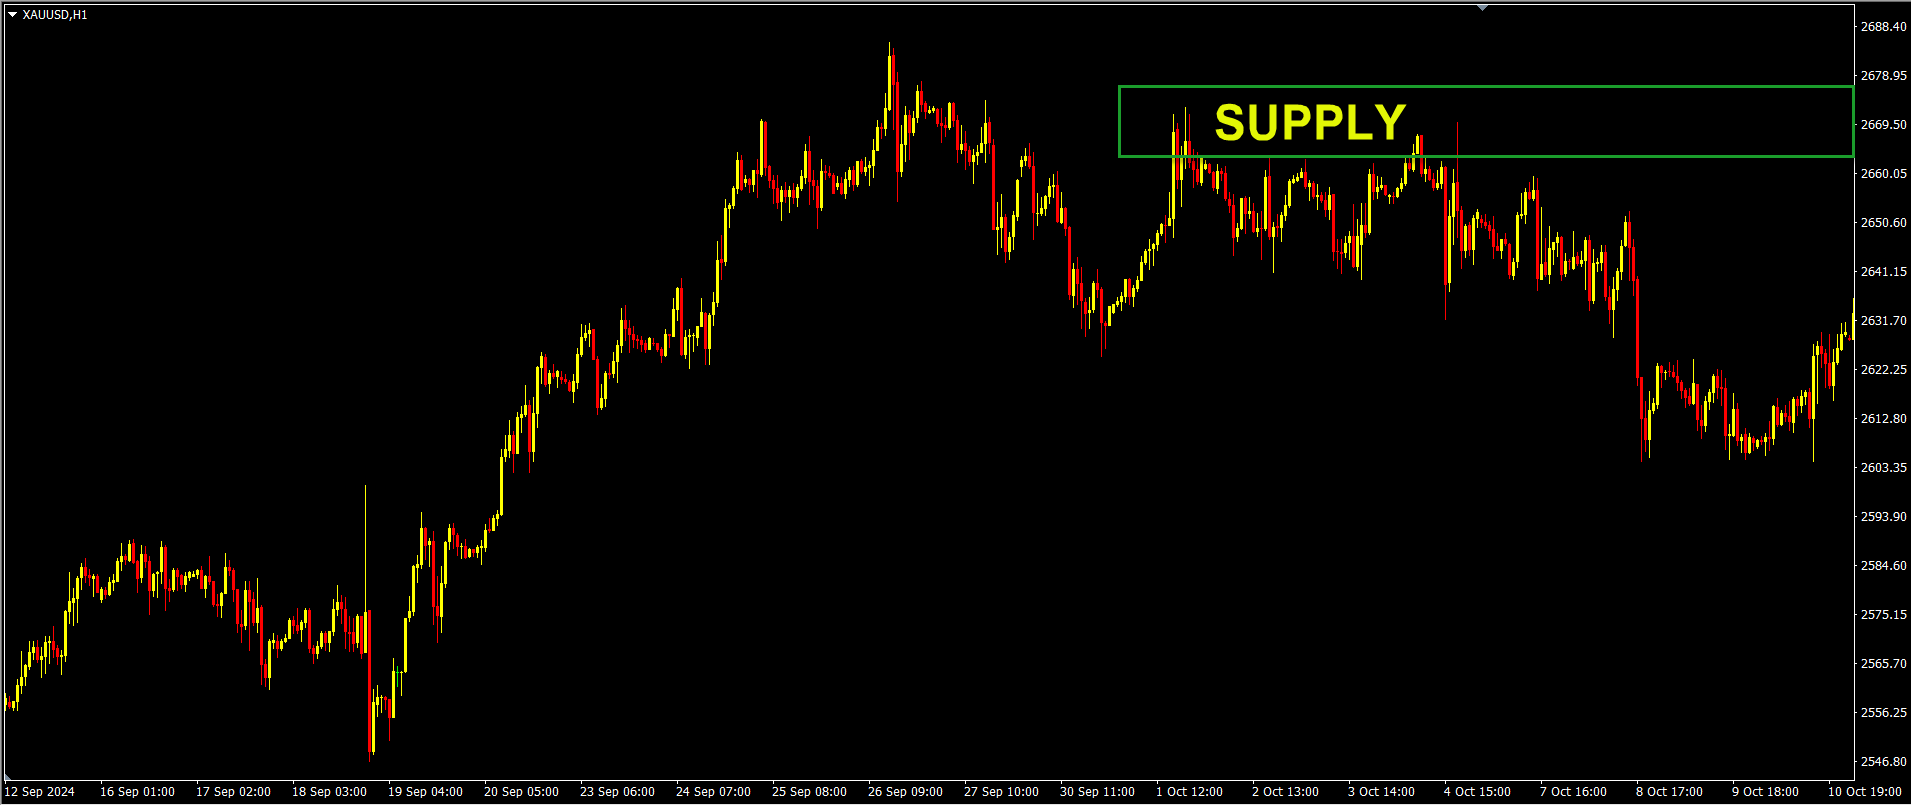
- A Supply Zone is a price area where selling pressure dominates and forces prices down. Think this way: “sellers piled in here, and the market fell”.
- Important: These zones are not precise lines. They are zones (width) because price doesn’t always turn exactly at a line — there is wiggle room.
By recognizing where demand or supply has previously dominated, you gain an advantage: you’re looking at where the market “took a side” before.
2. Why These Zones Matter in Forex Trading
Why should you care about supply & demand zones instead of just indicators? Here are some solid reasons:- They reflect real market psychology & order flow: Zones show where institutions, banks or large traders got involved. Knowing where they did gives you context.
- They help you place entries with better odds: If price returns to a strong demand zone, your odds of a bounce are higher.
- They improve risk management: Placing stop-losses below/above these zones makes sense because you know the “zone strength”.
- They give context for trend or reversal setups: A demand zone in a strong uptrend might mean continuation. In a downtrend, it could mean a reversal attempt.
3. How to Identify Supply & Demand Zones — Step by Step
Here’s your step-by-step process to spot these zones in your charts. Use higher timeframes (such as H4, Daily) for clarity, then refine with smaller time frames, like 1H.Step 1: Look for strong moves
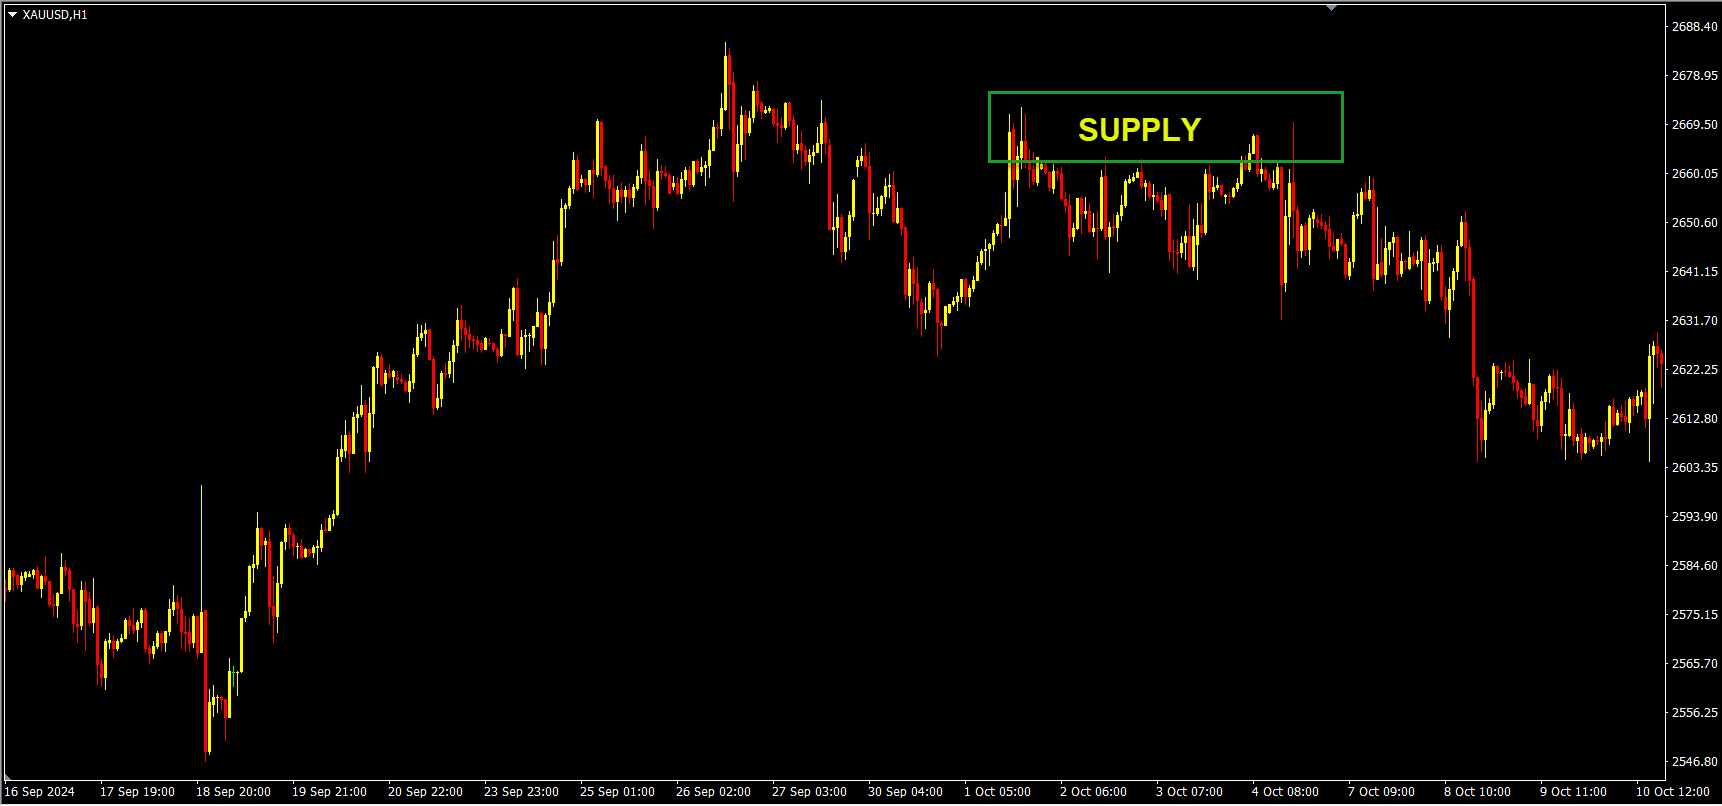
Find an area where price rallied strongly (for demand) or fell sharply (for supply). This suggests that a large number of orders were filled quickly, leaving a footprint.- Example: Price drops from 1.2000 to 1.1800 in one strong move → potential supply zone above.
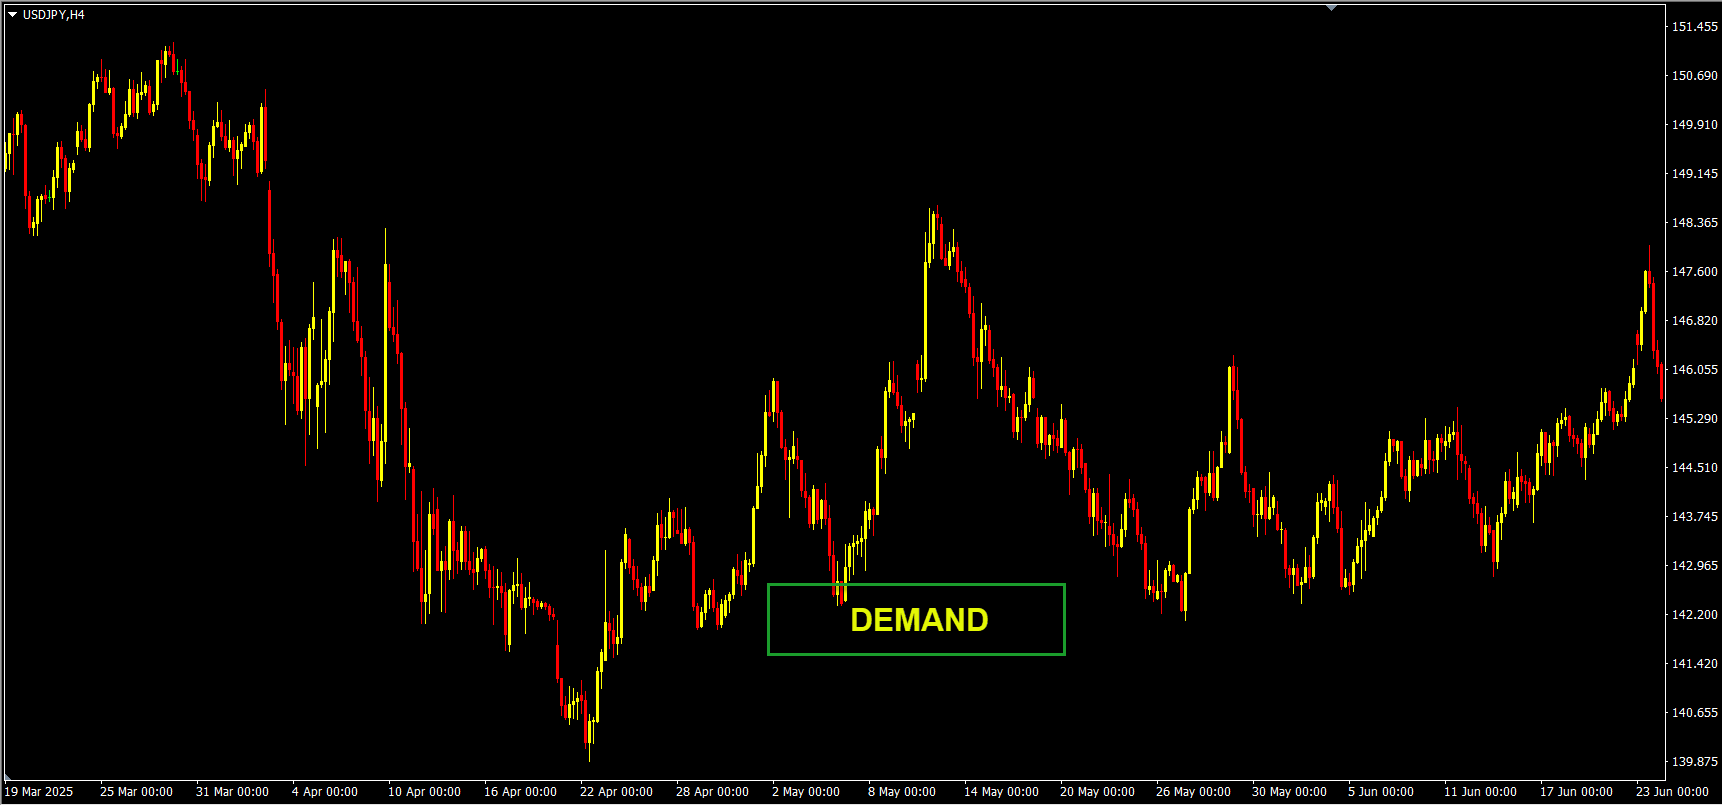
- Example: Price jumps from 1.1000 to 1.1300 → potential demand zone below.
Step 2: Locate the zone boundaries
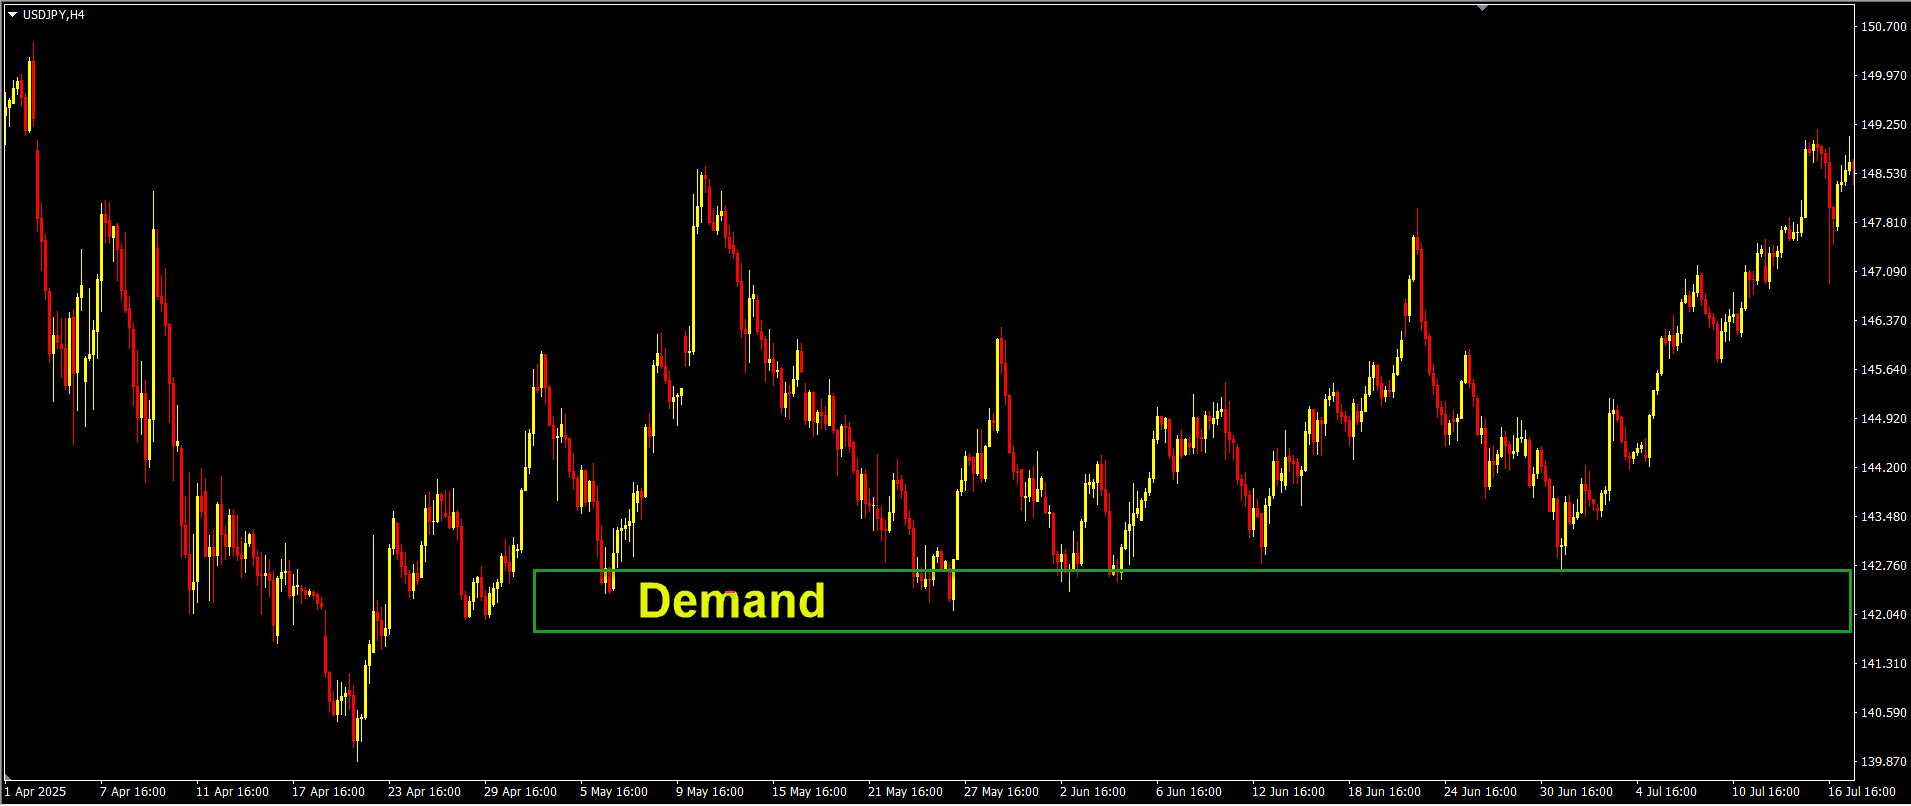
Once the strong move is spotted:- For a demand zone: draw a horizontal box from the bottom of the consolidation just before the strong move to the top of that consolidation block.
- For a supply zone: draw the box from the top of consolidation down to the bottom just before the big move.
Step 3: Mark the zone on your chart
Extend the box into the future – it becomes your “zone to watch”.- If the price returns into that box, you observe how the price behaves.
- The zone is “live” until broken or invalidated.
Step 4: Confirm with touches & reactions
The stronger a zone, the more times the price has respected it (bounced/rejected). For instance:- A demand zone with 2-3 or more prior bounces is stronger.
- A supply zone that saw multiple rejections is a high-probability area.
Step 5: Use multiple timeframes
- On Daily: mark major zones.
- On H4 or H1: refine entry inside the larger zone (such as a smaller retracement inside the big zone). This gives you a broader market analysis + shorter optimized entries.
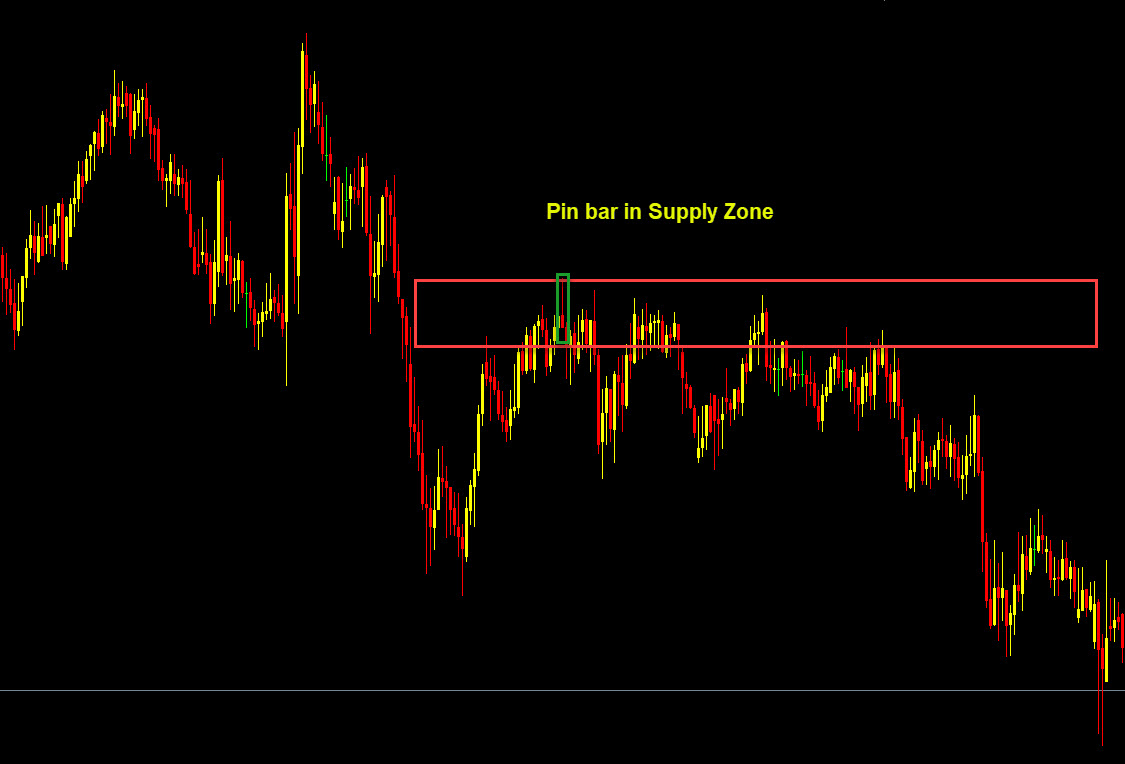
Step 6: Watch for price action/trigger signals
When price re‐enters the zone, don’t just jump in. Wait for confirmation:- A rejection candle (like a pin bar, hammer, engulfing etc..) inside the zone.
- A strong price rejection – candles that create lower highs and lower lows, for example.
- Volume spike, or sudden acceleration out of zone. This increases the odds that the zone still matters.
4. Practical Strategies Using Supply & Demand Zones
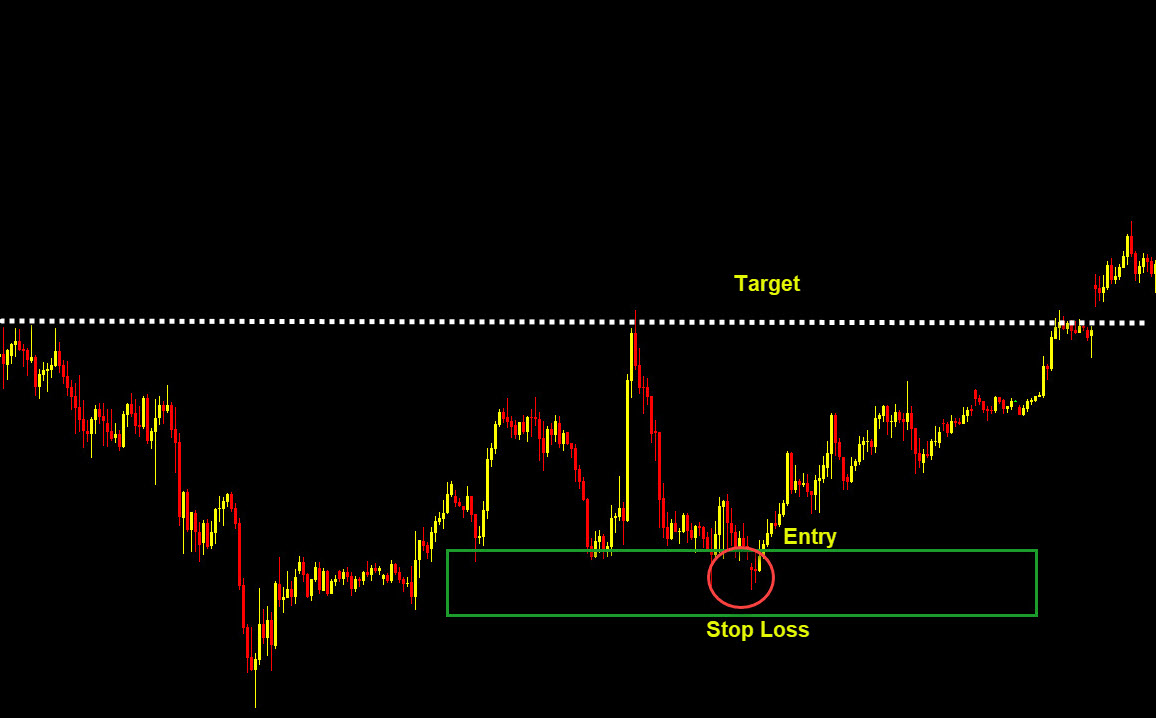
Here are two practical ways to trade using these zones: Strategy A: Bounce from Demand Zone- Identify a strong demand zone.
- Price returns to the zone for retesting.
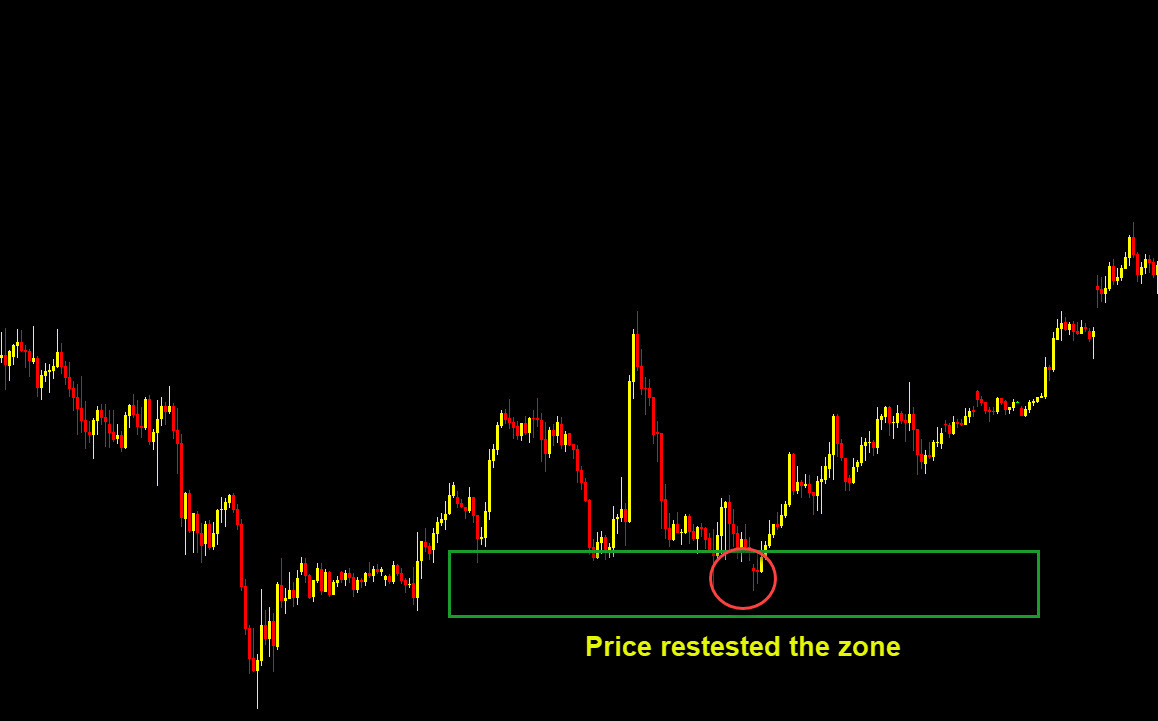
- Wait for a bullish signal inside the zone.
- Entry: once the price confirms the signal.
- Stop-loss: below the zone’s low (give some buffer).
- Target: next key resistance or supply zone.
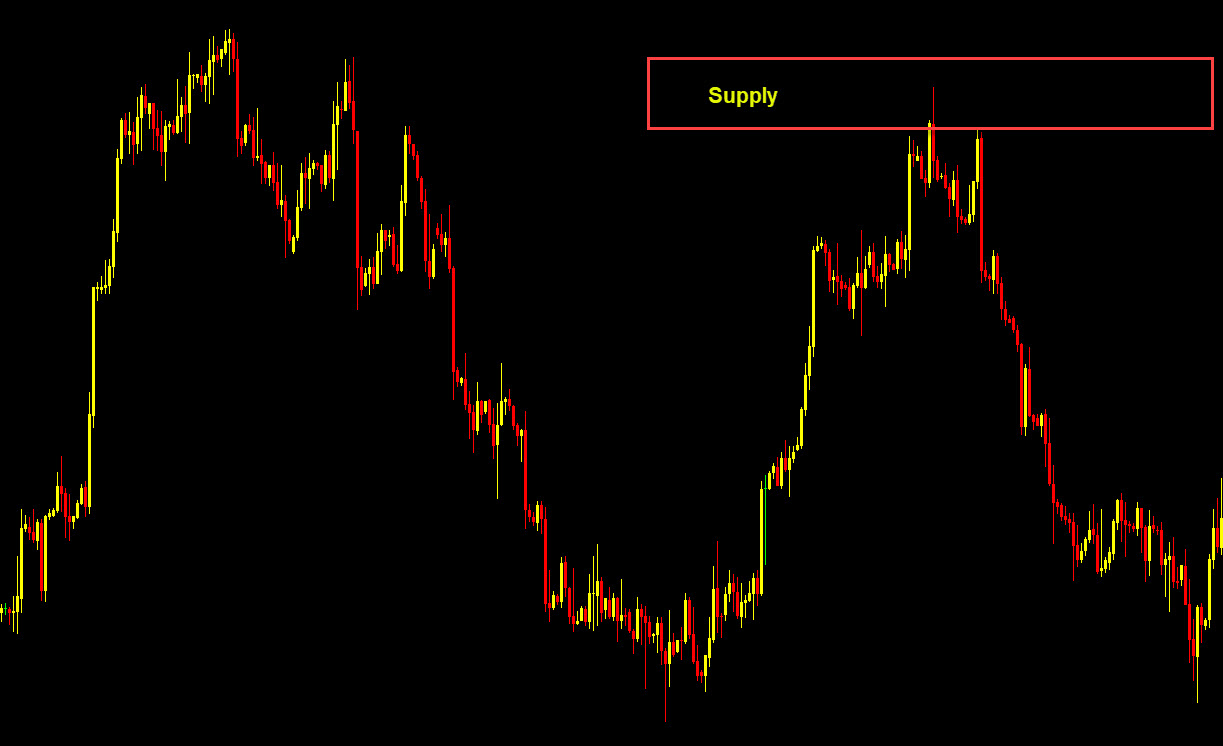
Strategy B: Breakout into Supply Zone
- Identify a supply zone (price dropped sharply from it previously).
- Price breaks into the zone (coming up into it).
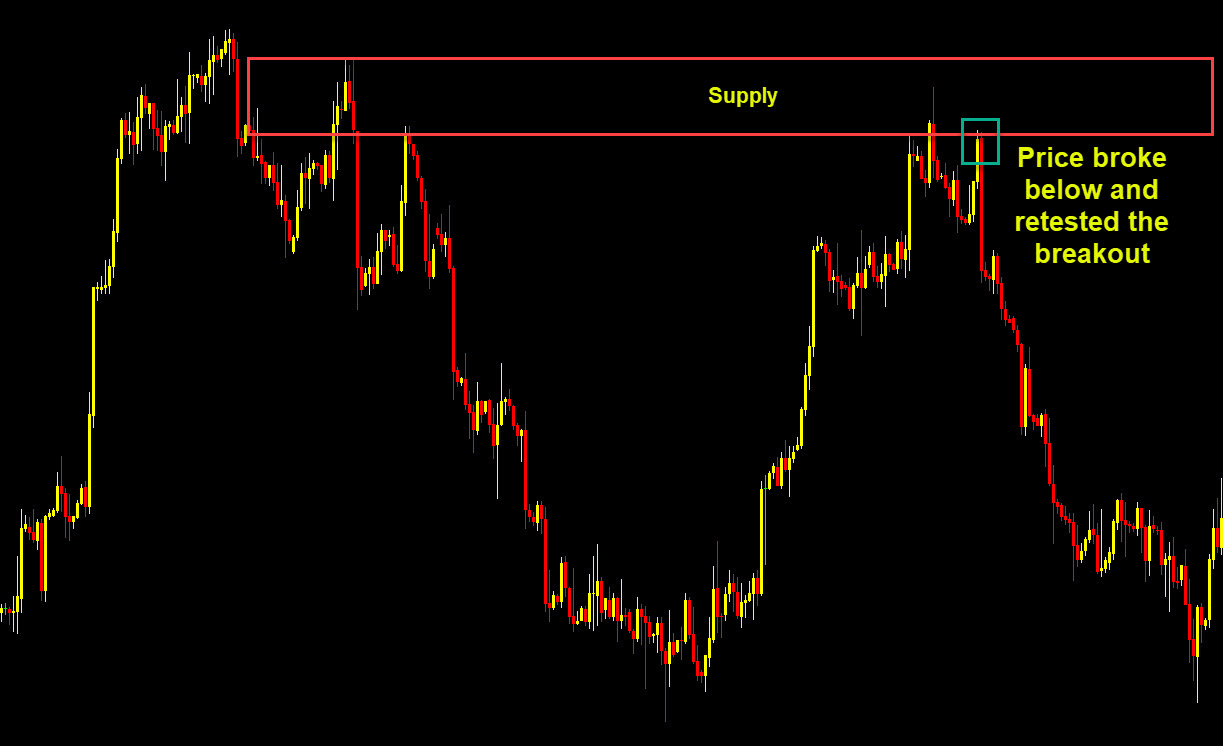
- Instead of trading it like a bounce, you wait to see if it resists (turns down) or breaks through (then retests).
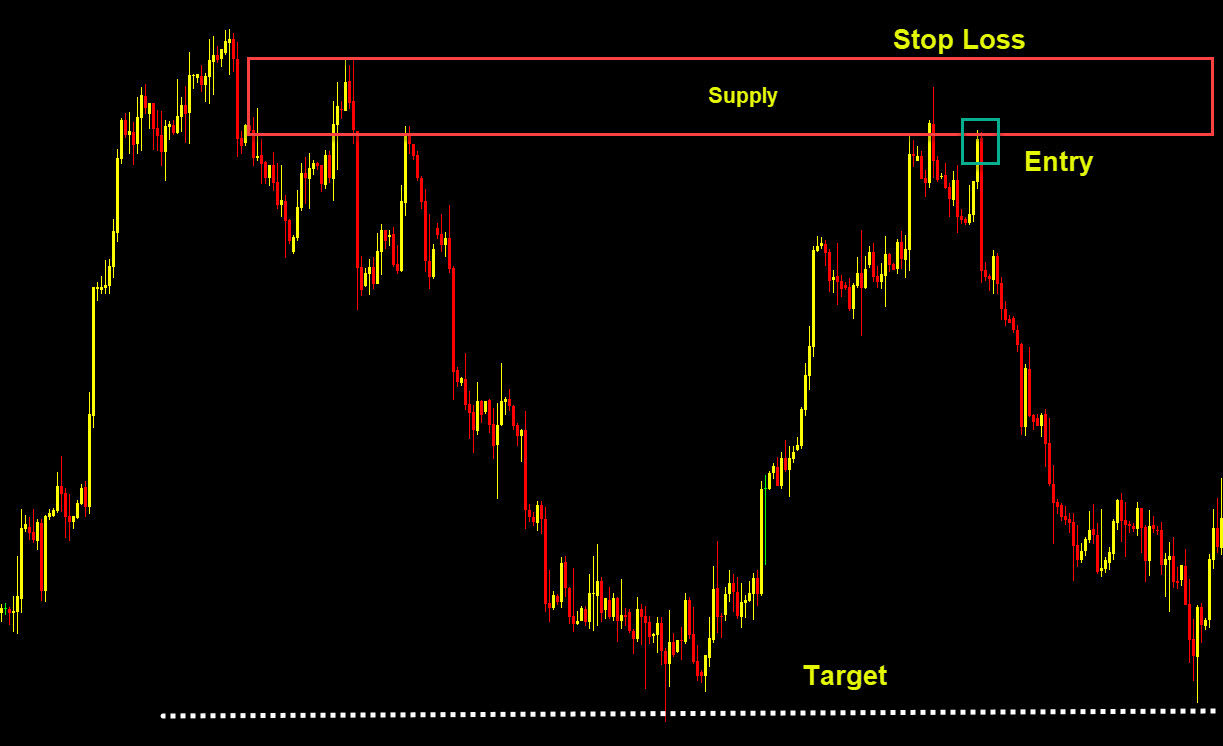
- If price retests from inside the zone and fails, that’s a short entry.
- Stop-loss: above the zone high with some buffer.
- Target: next demand zone or major support.
5. Pitfalls & Mistakes to Avoid
Even good zones won’t work every time. Here are common traps and how to avoid them.- Zone drawn too wide or vague → if your zone is huge, it loses precision. Try to keep zone width reasonable.
- Trading without confirmation → falling into a zone and trading instantly increases risk. Wait for a valid trigger.
- Ignoring context (trend, fundamentals) → a supply zone may look valid, but if a major fundamental event shifts the market, you’ll be blindsided.
- No stop-loss or too tight stop → respect risk. Zone invalidation happens.
- Overcrowded zones → if many traders see the same zone, the reaction may not be strong (everyone’s expecting the same). Use additional filters (volume, trend, higher timeframe).
- Chasing trades outside a zone → waiting for price to return to the zone gives you better odds; jumping too early is like trying to catch a falling knife.
6. Final Thoughts & Wisdom
- Supply & demand zones are powerful because they address why prices move, not just how.
- Always keep context in mind: timeframe, trend, market events.
- Patience is your friend: the best setups often come after waiting.
- Risk management wins over any “perfect zone”. A zone is never a guarantee; treat it as an edge, not a certainty.
- Keep it clean: clear zones, clear rules, clear mindset.