Indicators are tools — nothing more, nothing less. Indicators INDICATE, but the price dictates!. They are meant to
support your decision-making , not replace it. Remember this – Indicators INDICATE, but the price dictates!
Among the most widely used indicators in Forex trading are
RSI, MACD, and Stochastic , each offering a different perspective on market behavior.
When used correctly, they help you understand
momentum, trend strength, and potential turning points . When misused, they create confusion.
In this guide, you’ll learn:
- What RSI, MACD, and Stochastic actually measure
- How to interpret their signals in plain language
- Where each indicator performs best and in what conditions
- Their weaknesses and how to avoid common mistakes
- How to combine them into a structured trading approach
1. RSI — Relative Strength Index
The
RSI (Relative Strength Index) measures the strength of recent price moves by comparing average gains to average losses over a fixed period (usually 14 periods,
candles/ bars ).

🔹 What RSI Really Shows
RSI is a momentum-based indicator. Its role is to show
how much force is behind recent price movement — whether buyers or sellers are currently in control.
It moves within a fixed scale from
0 to 100 , making it easy to compare momentum conditions across different markets and timeframes.
🔹 How RSI Is Calculated (In Simple Terms)
RSI looks at recent price changes and compares:
- The average gains of upward moves
- The average loss during downward moves
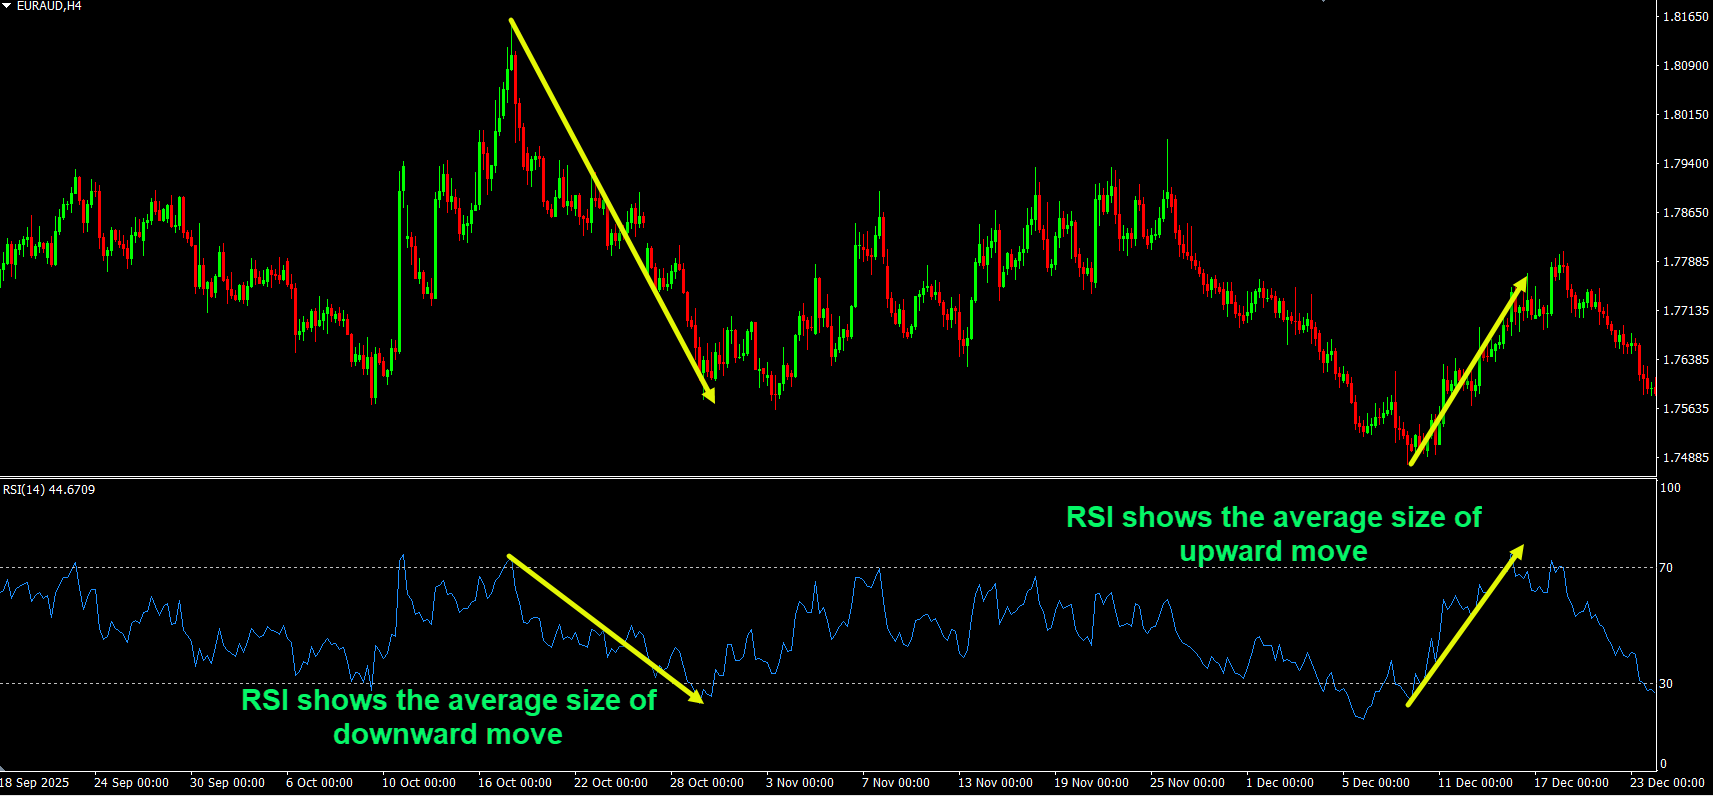
🔍 What “Average Gain” and “Average Loss” Mean
- Average Gain = average of all upward (bullish) closes over the lookback period
- Average Loss = average of all downward (bearish) closes over the lookback period
- Losses are treated as positive values in the calculation
(Default lookback =
14 periods ) When upward moves dominate, RSI rises. When downward moves dominate, RSI falls.
Main levels traders watch:
- Above 70 → market may be stretched to the upside and enter an overbought zone
- Below 30 → market may be stretched to the downside and enter an oversold zone
- Above/Below 50 → to understand who has the control, the buyers or the sellers
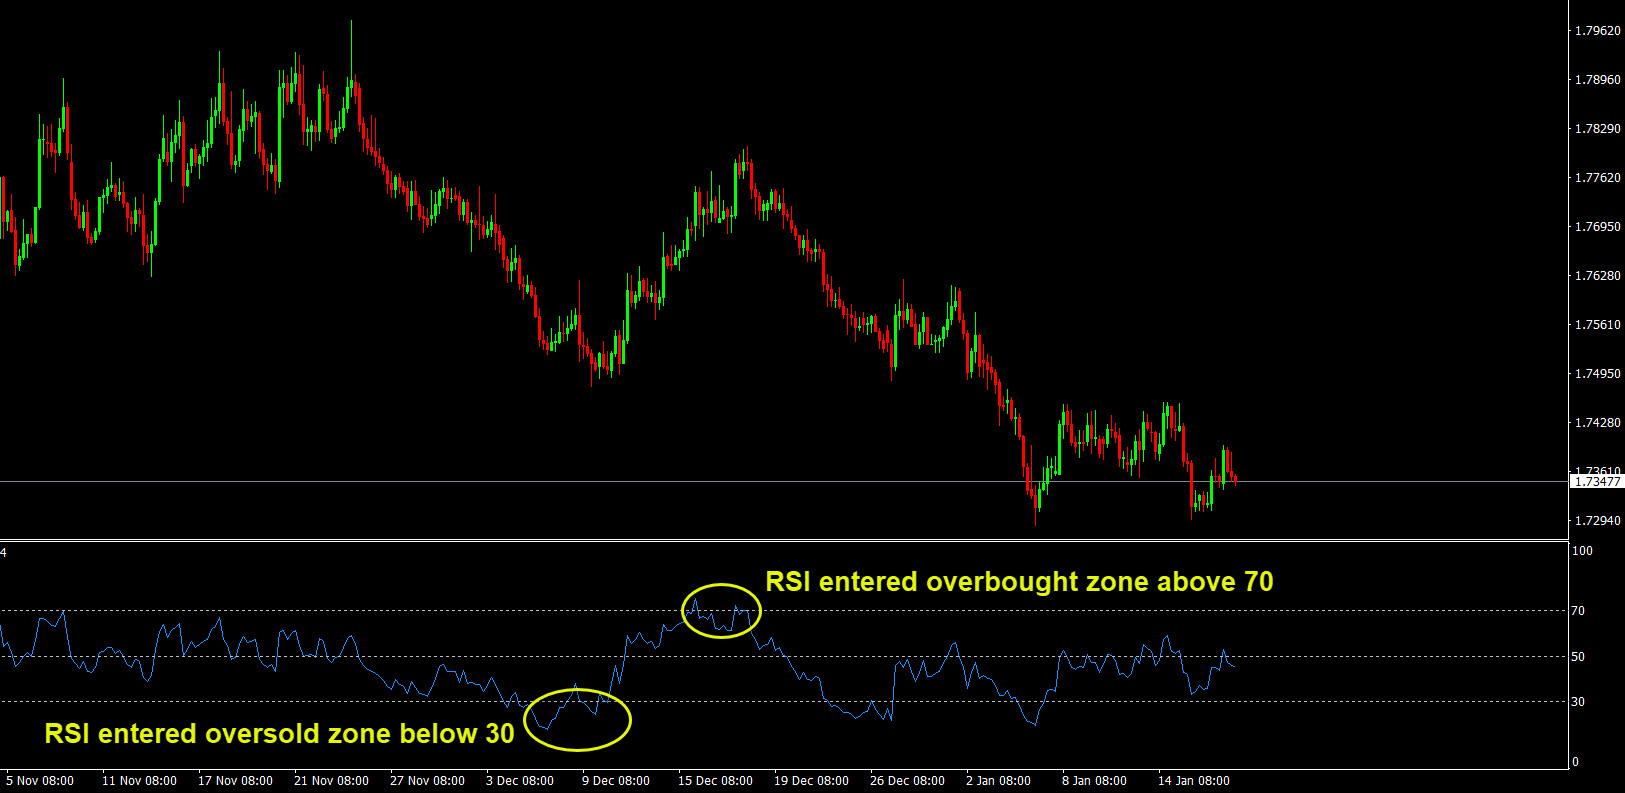
These zones signal
conditions , not automatic trade entries.
🔹 Using RSI in Real Trading
➤ Momentum Confirmation
Instead of focusing only on 70 and 30 for overbought and oversold conditions, many traders use RSI’s midpoint:
- RSI holding above 50 → bullish pressure remains strong
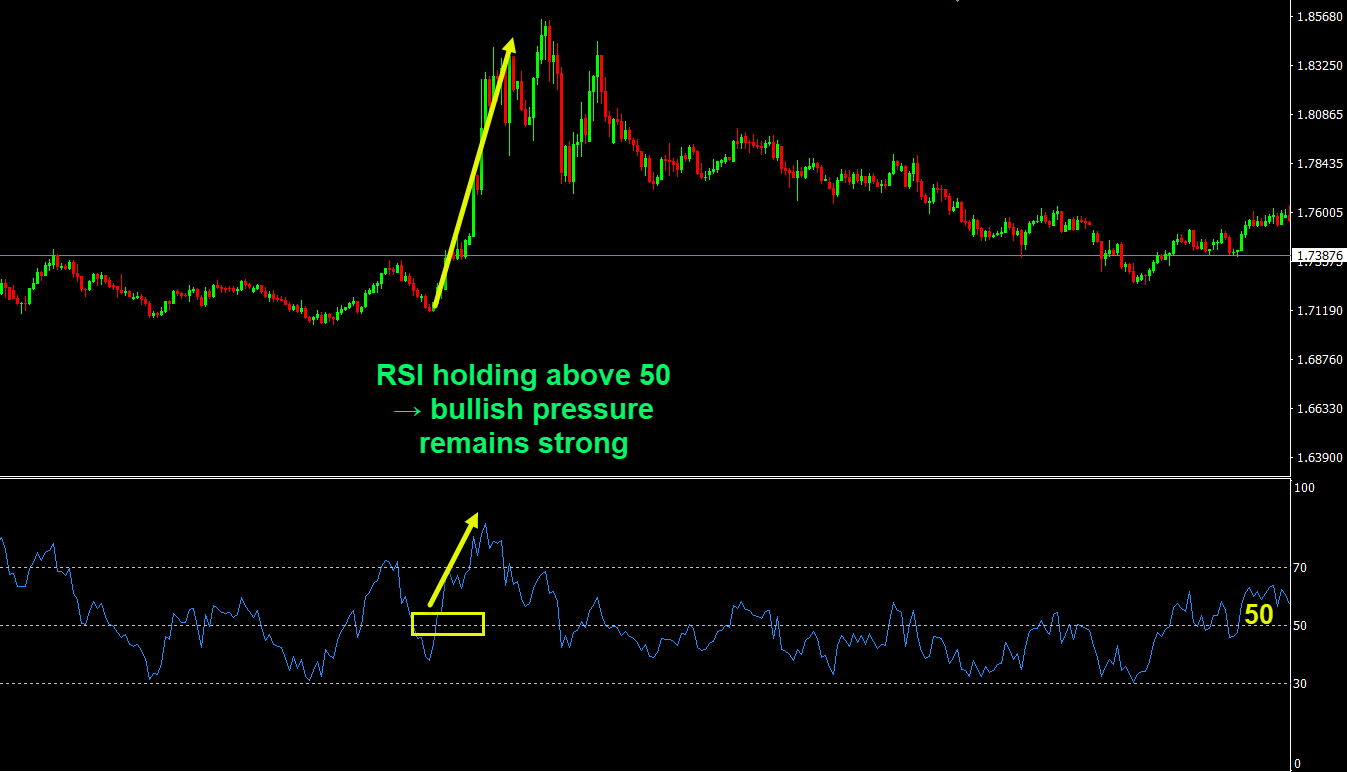
- RSI staying below 50 → bearish pressure dominates
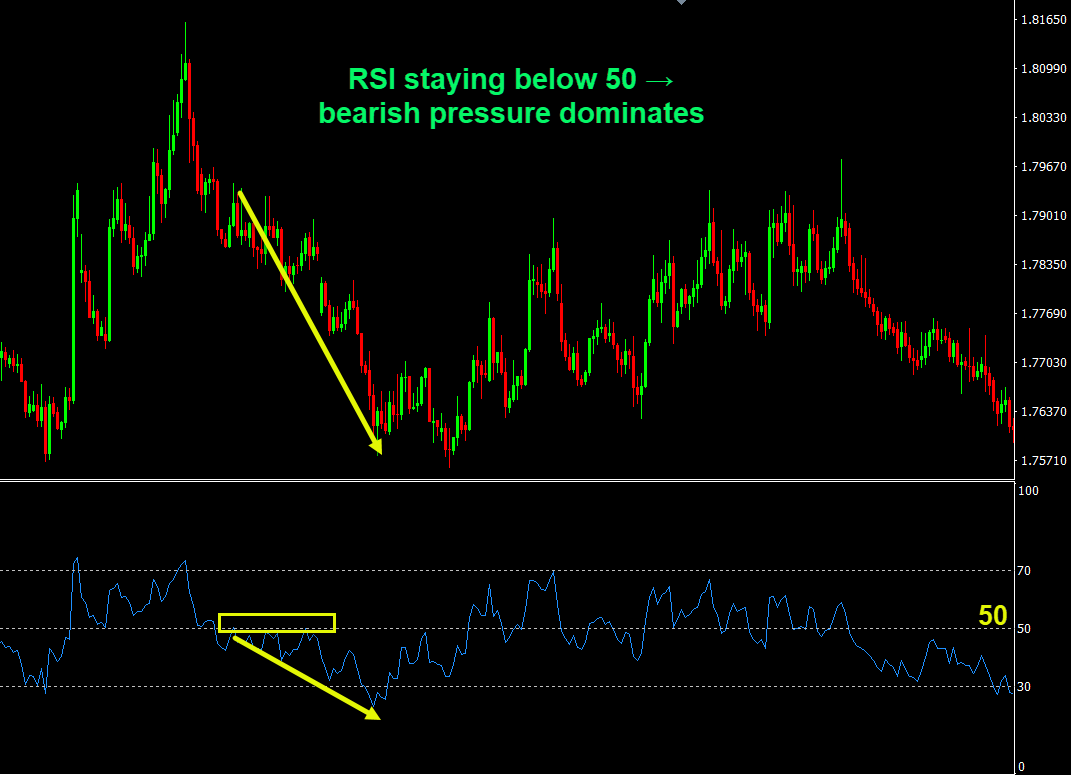
This is especially useful for trend confirmation.
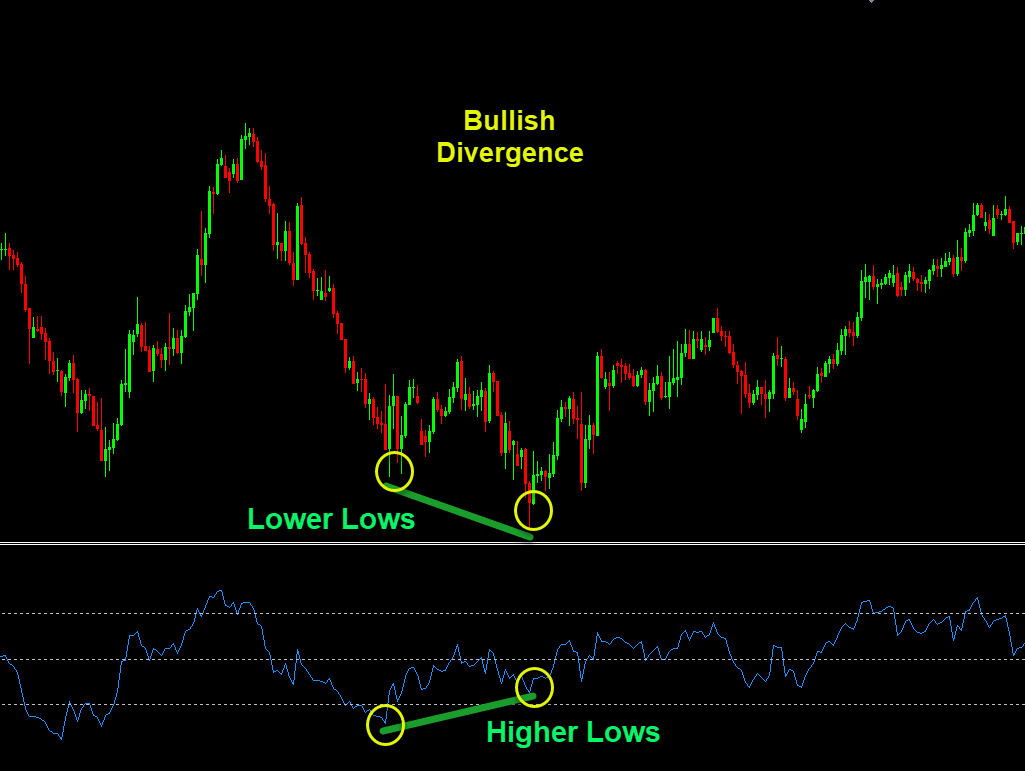
➤ Divergence Analysis
RSI can warn when price movement is losing strength and a potential reversal is forming:
- Bullish divergence: price continues to push lower and makes lower lows, but RSI starts forming higher lows — selling pressure is fading
- Bearish divergence: price keeps pushing higher and makes higher highs, while RSI forms lower highs — buying strength is weakening, and a reversal is building up potentially.
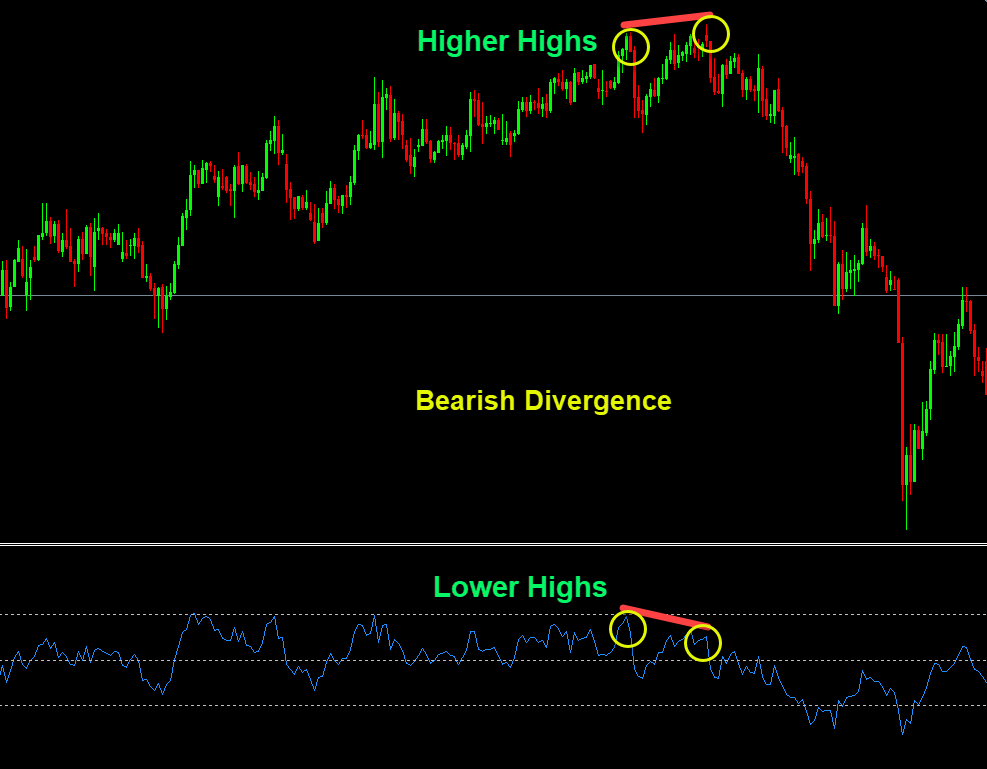
These situations often appear
before corrections or reversals , not after.
🔹 RSI Limitations
⚠️ During strong trends, RSI can remain in extreme zones longer than expected⚠️ RSI signals should always be supported by structure, trend, or price action
2. MACD — Moving Average Convergence Divergence
🔹 What MACD Measures
MACD focuses on
trend direction and momentum changes , using moving averages as its foundation.
Instead of asking “Is the market overbought or oversold?”, MACD asks:
👉 Is momentum increasing or decreasing in the direction of the trend?
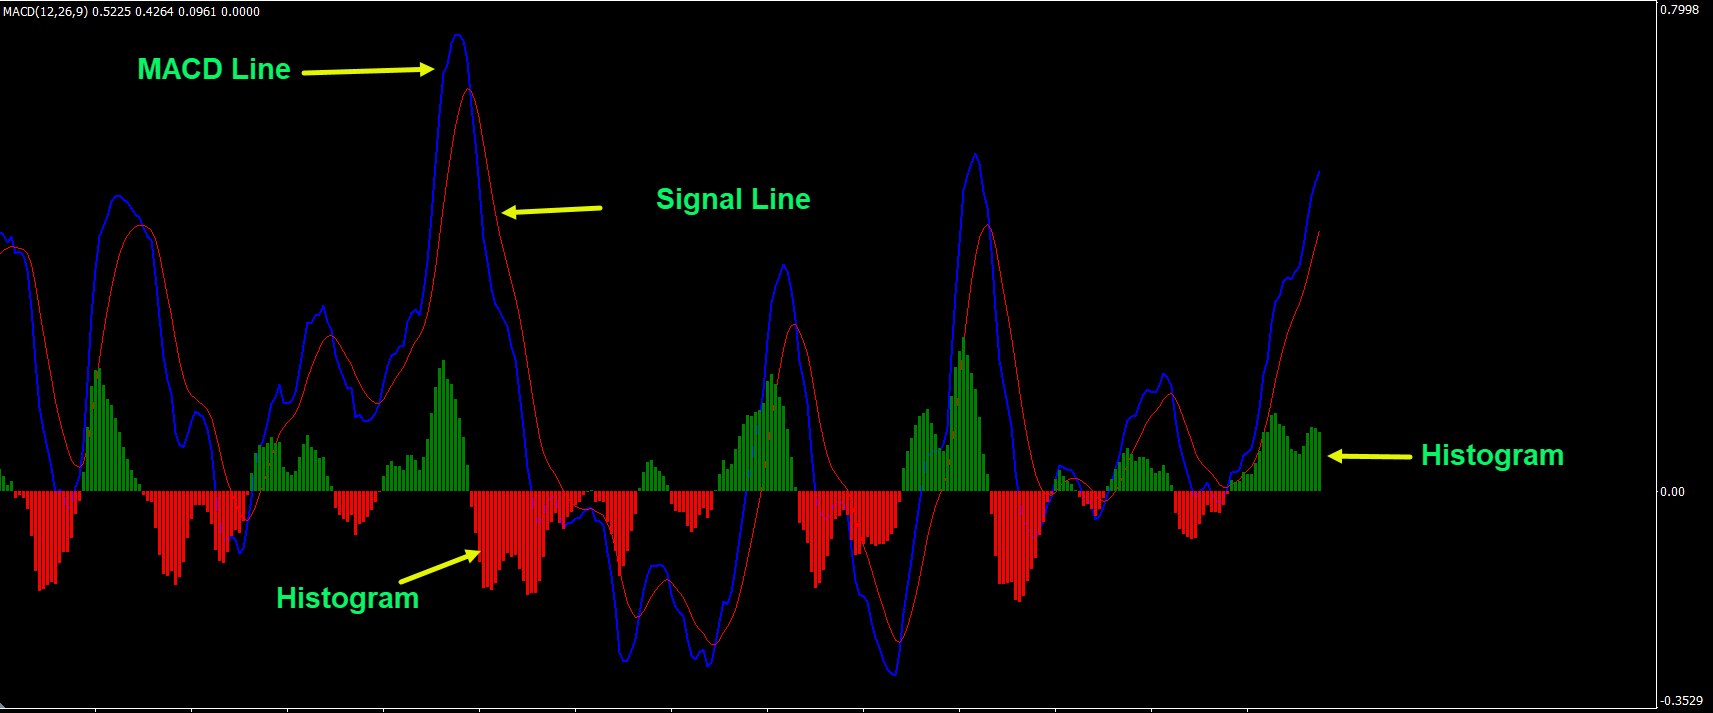
🔹 MACD Components Explained
MACD is made up of three parts:
- MACD Line — difference between two moving averages
12-period EMA → fast / short-term momentum
26-period EMA → slow / longer-term momentum
- Signal Line — smoothed version of the MACD Line The signal line is a 9-period Exponential Moving Average (EMA) of the MACD line itself .
- Histogram — visual distance between the two lines
Together, they show momentum shifts clearly.
🔹 Interpreting MACD Signals
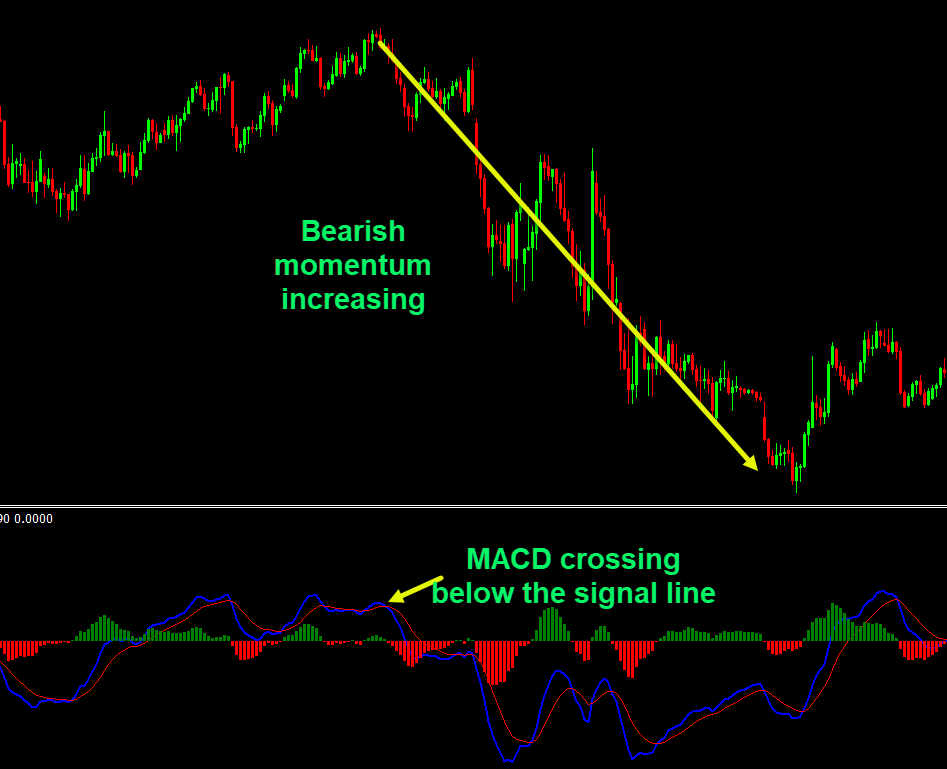
➤ Line Crossovers
- MACD crossing above the signal line → bullish momentum increasing
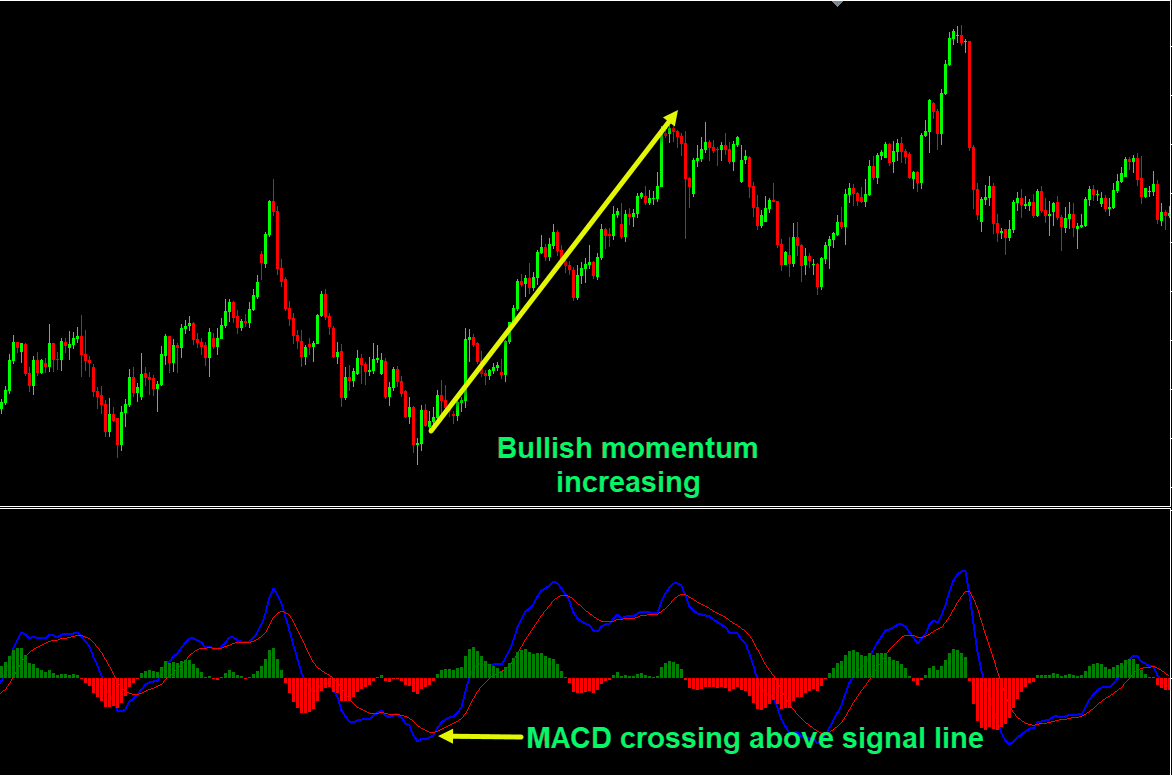
- MACD crossing below the signal line → bearish momentum increasing
These are most effective when aligned with the higher-timeframe trend.
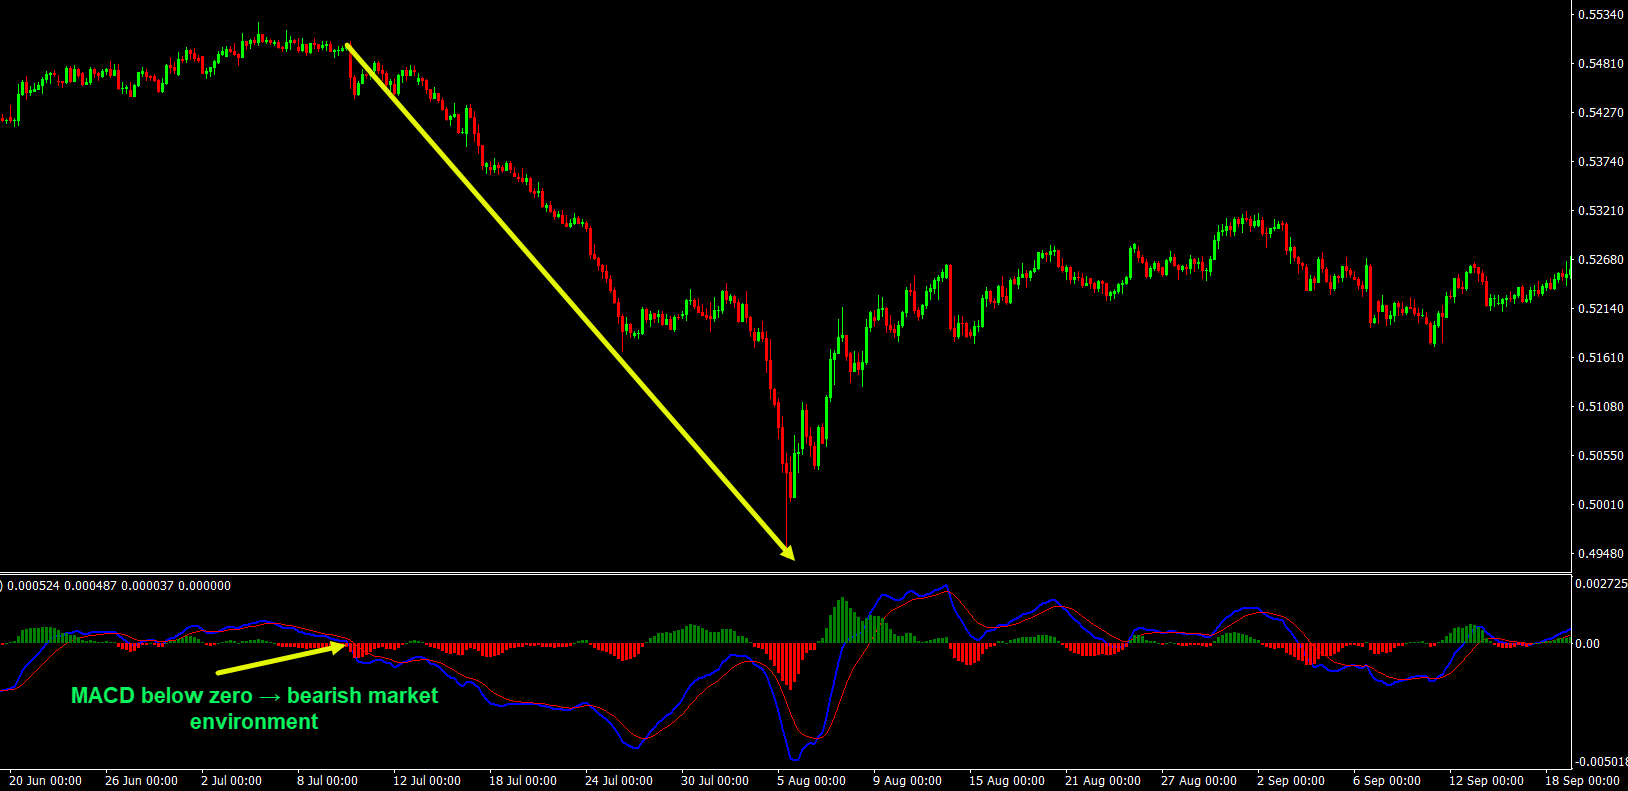
➤ Zero-Line Interaction
The zero line is a horizontal line that separates the bullish and bearish sentiment. Histogram or moving averages of the MACD above the zero usually happen during a bullish market, and a negative, below the zero, histogram or moving averages of the MACD usually happen during a bearish market.
- MACD above zero → bullish market environment
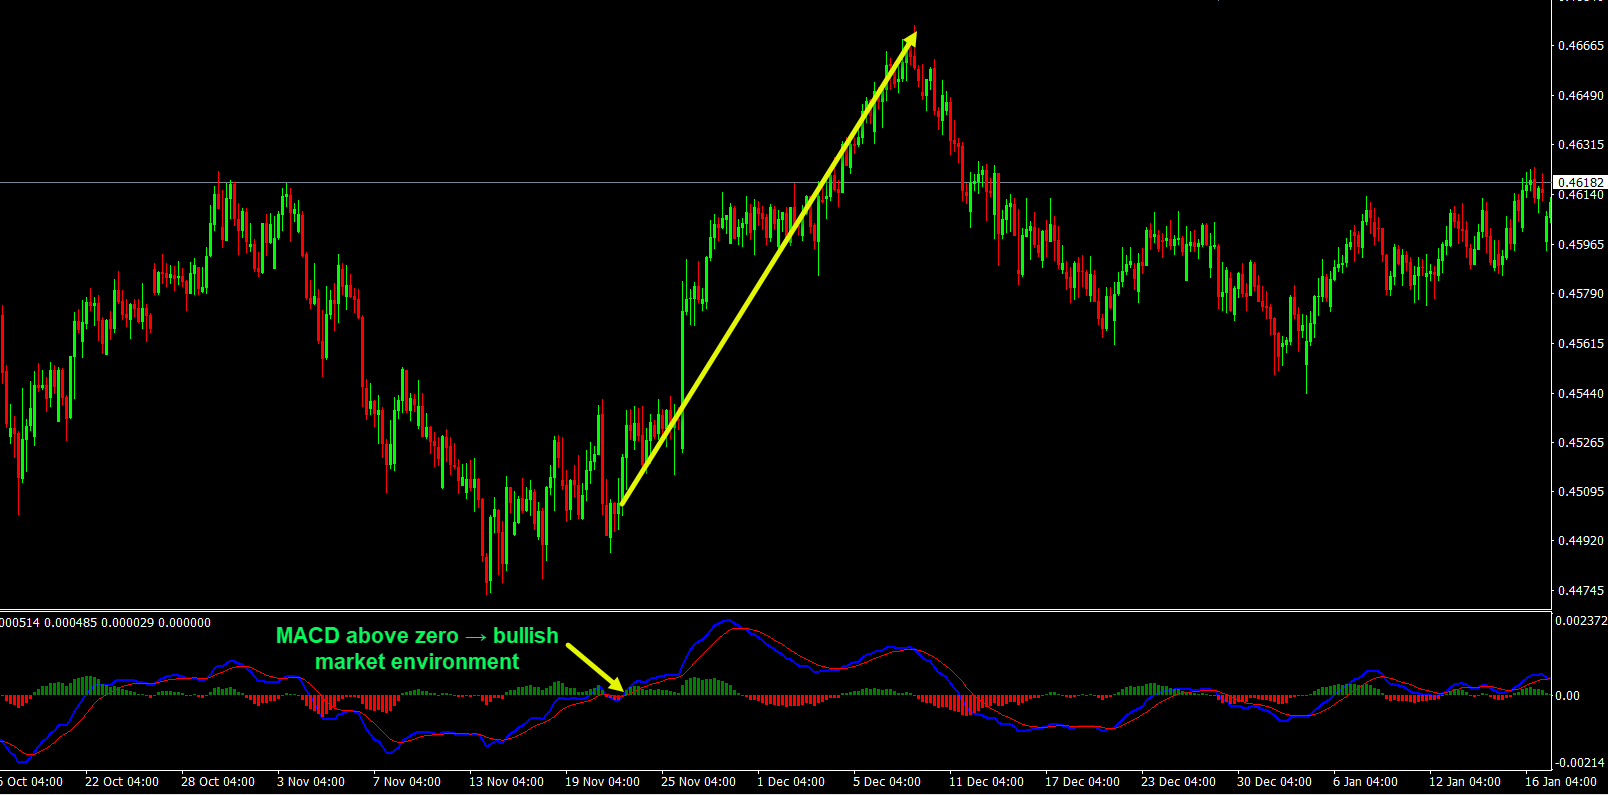
- MACD below zero → bearish market environment
Crossing the zero line often confirms
trend transitions .
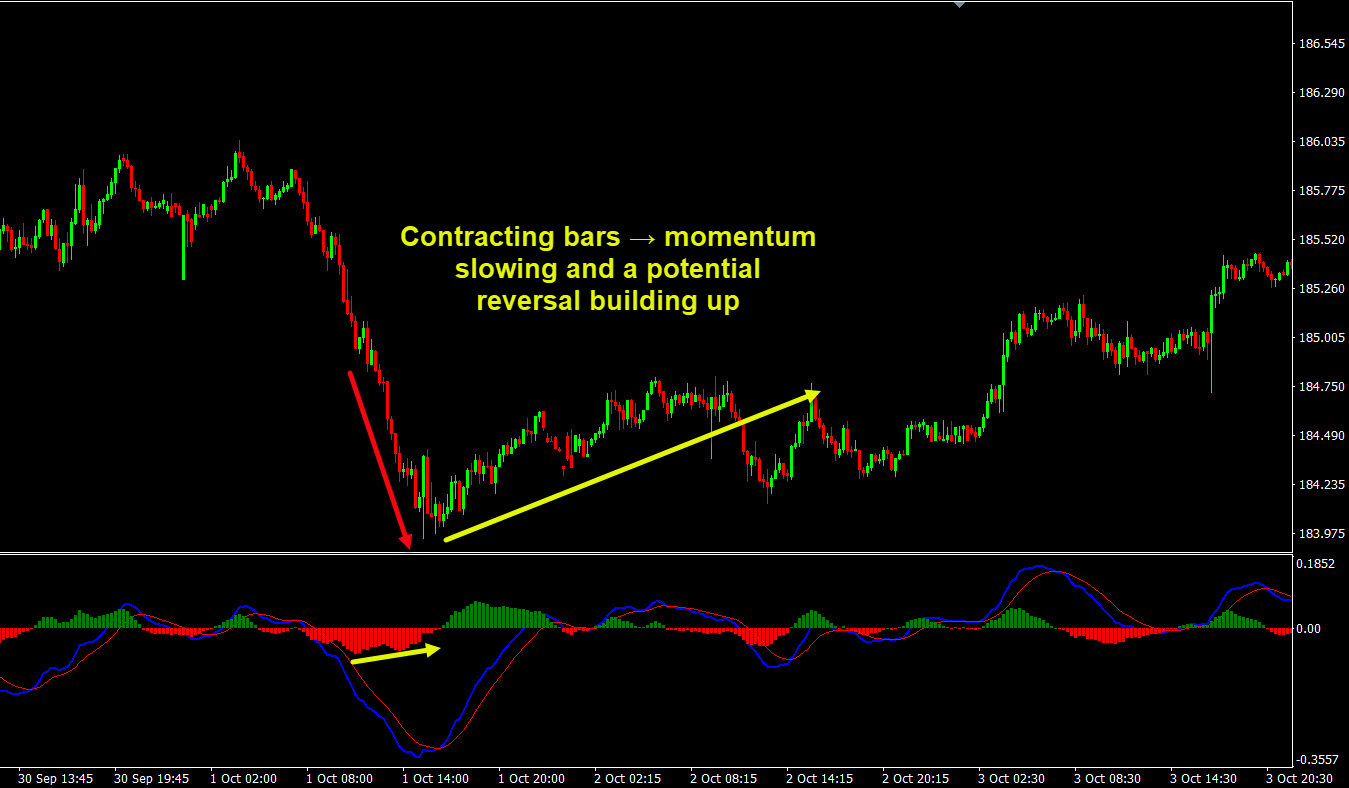
➤ Histogram Behavior
- Expanding bars → momentum accelerating
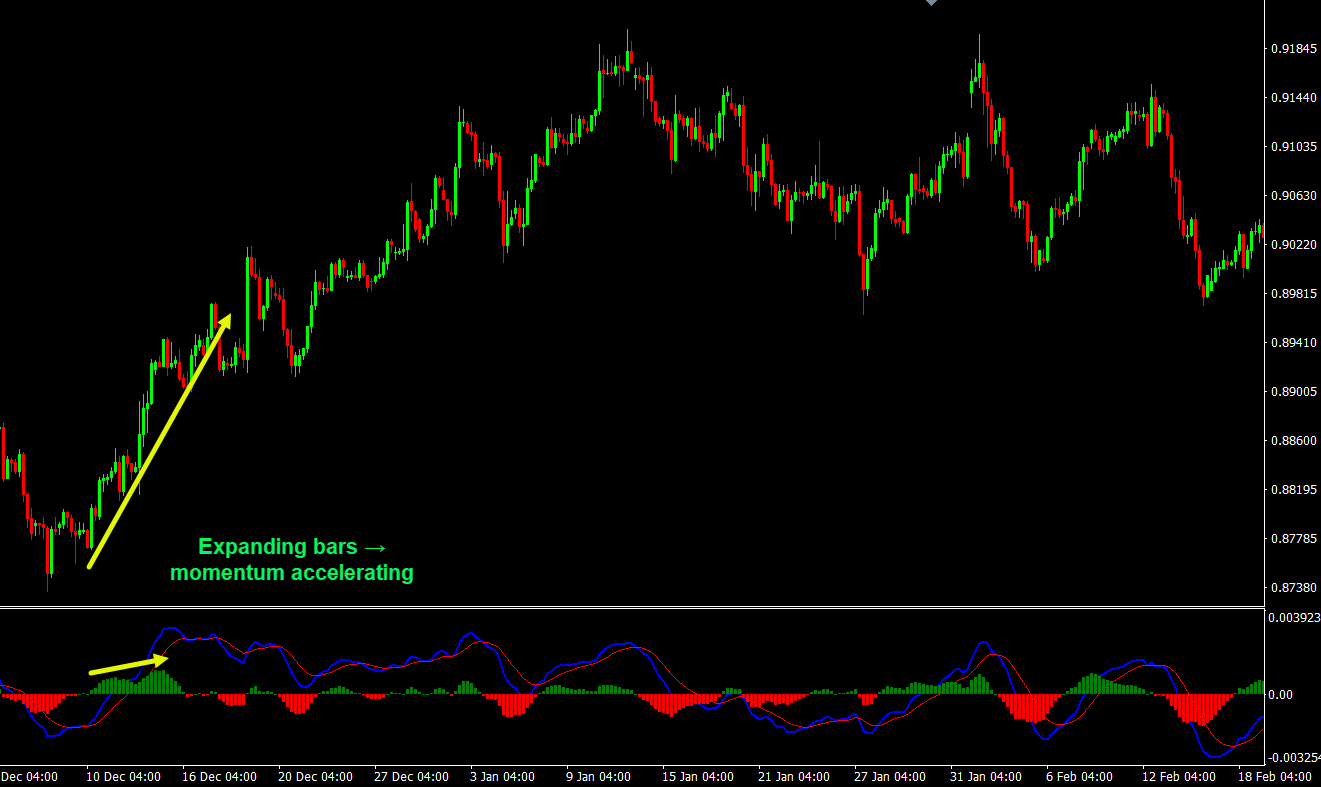
- Contracting bars → momentum slowing and a potential reversal building up
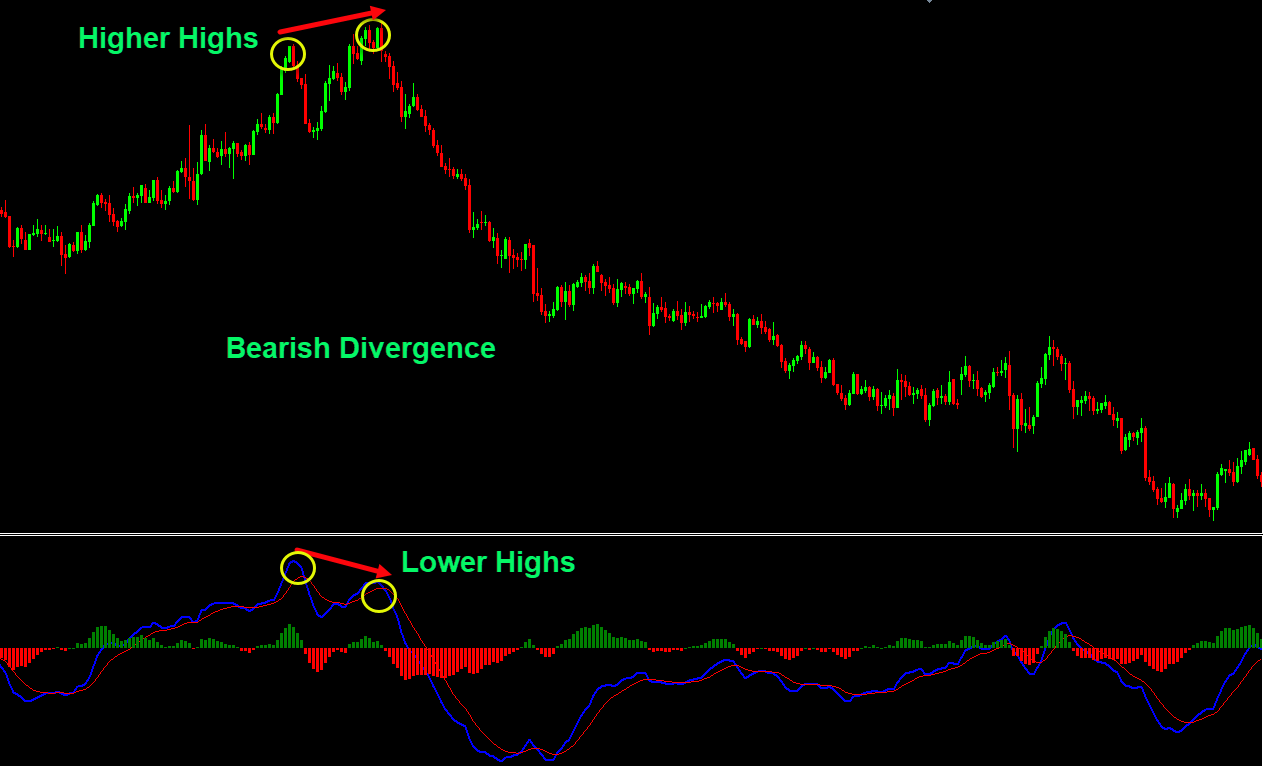
 ➤ Divergence Analysis
MACD indicates when price movement is losing strength and a potential reversal is forming:
- Bullish divergence: price continues to push lower and makes lower lows, but MACD starts forming higher lows — selling pressure is fading
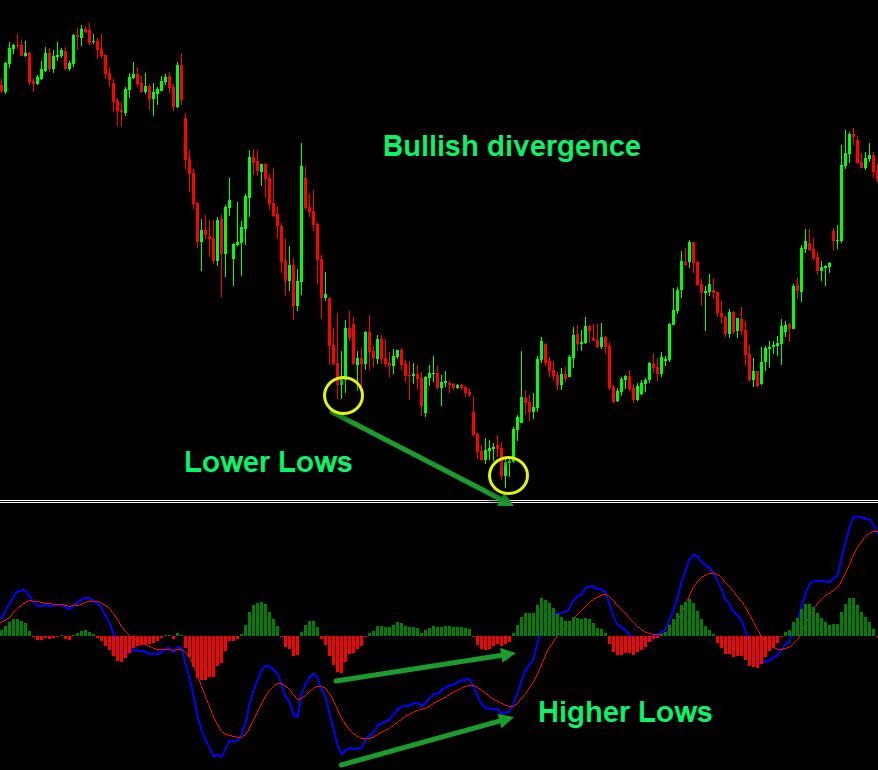
- Bearish divergence: price keeps pushing higher and makes higher highs, while MACD forms lower highs — buying strength is weakening, and a reversal is building up potentially.
This helps traders judge whether to
hold, exit, or avoid trades .
🔹 MACD Limitations
⚠️ MACD reacts after price moves — it does not lead price⚠️ Sideways markets can generate frequent false signals
3. Stochastic Oscillator
🔹 What Stochastic Focuses On
Stochastic answers a different question:
👉 Where is the current price trading compared to its recent range?
It also fluctuates between
0 and 100 , like the RSI indicator we saw above, but its purpose differs from RSI.
While RSI evaluates momentum intensity,
Stochastic highlights price placement within recent highs and lows .
1️⃣ %K Line (Main Line)
Formula:
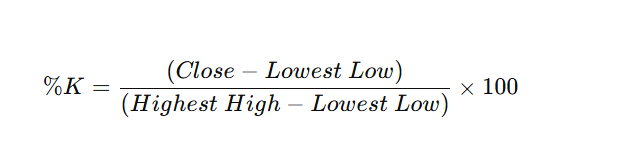 Where (usually over 14 periods):
- Close = current closing price
- Lowest Low = lowest price in the last 14 candles
- Highest High = highest price in the last 14 candles
2️⃣ %D Line (Signal Line)
- %D = 3-period moving average of %K
- Most platforms use a Simple Moving Average (SMA)
So:
%D = SMA(3) of %K
🔹 Stochastic Structure
- %K line — faster reaction
- %D line — smoothed signal line
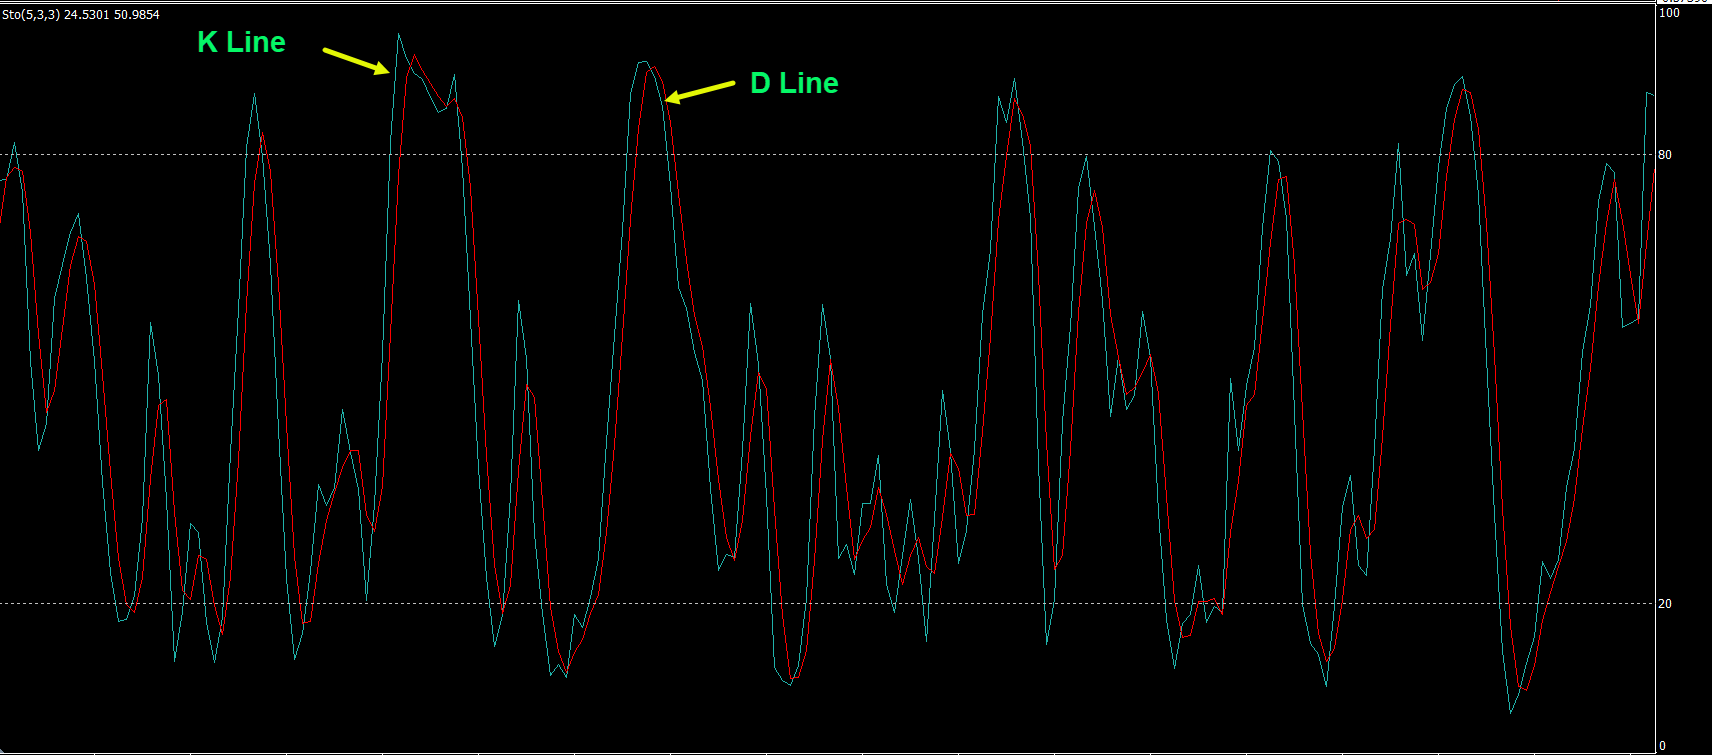
Crossovers between these lines provide timing cues.
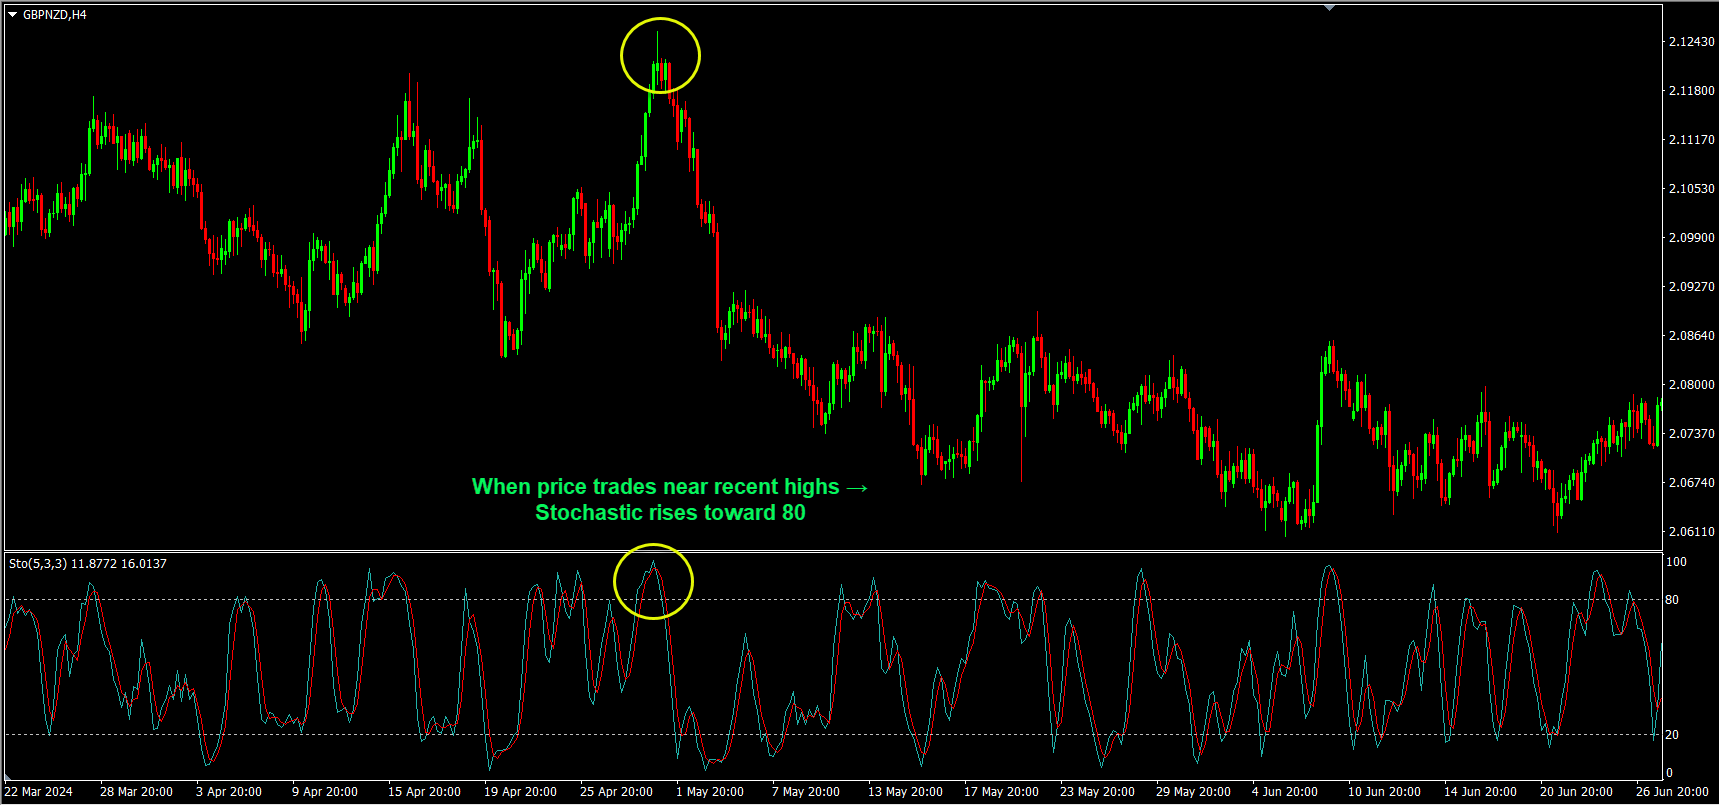
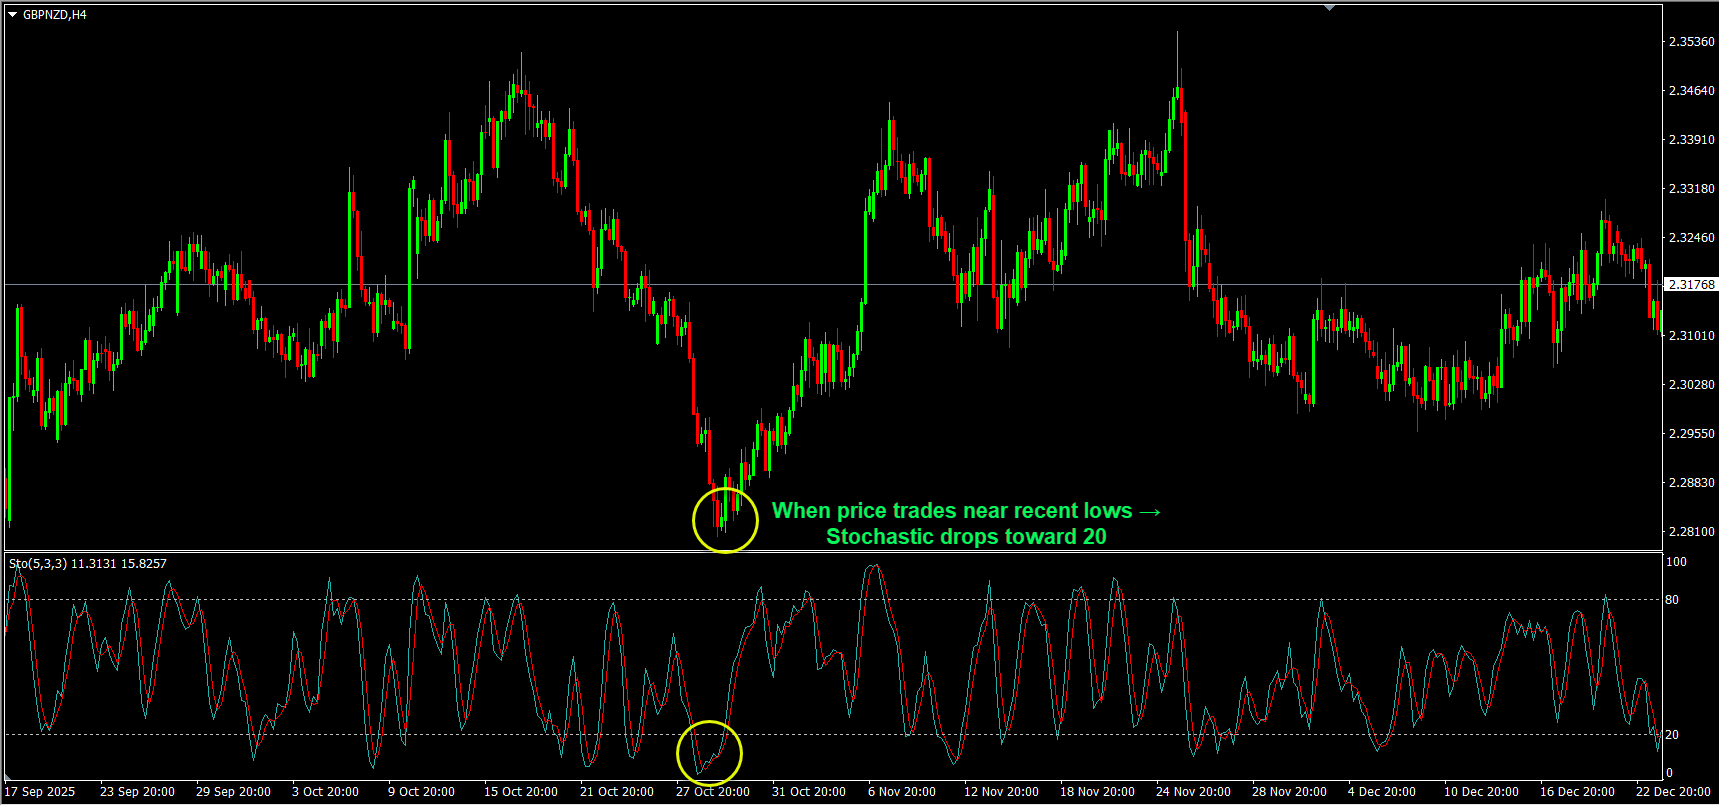
🔹 How Stochastic Works
- When price trades near recent highs → Stochastic usually rises toward 80 or above
- When price trades near recent lows → Stochastic drops to or below 20
Common reference zones:
- Above 80 → market trading near recent highs and might be around overbought zone
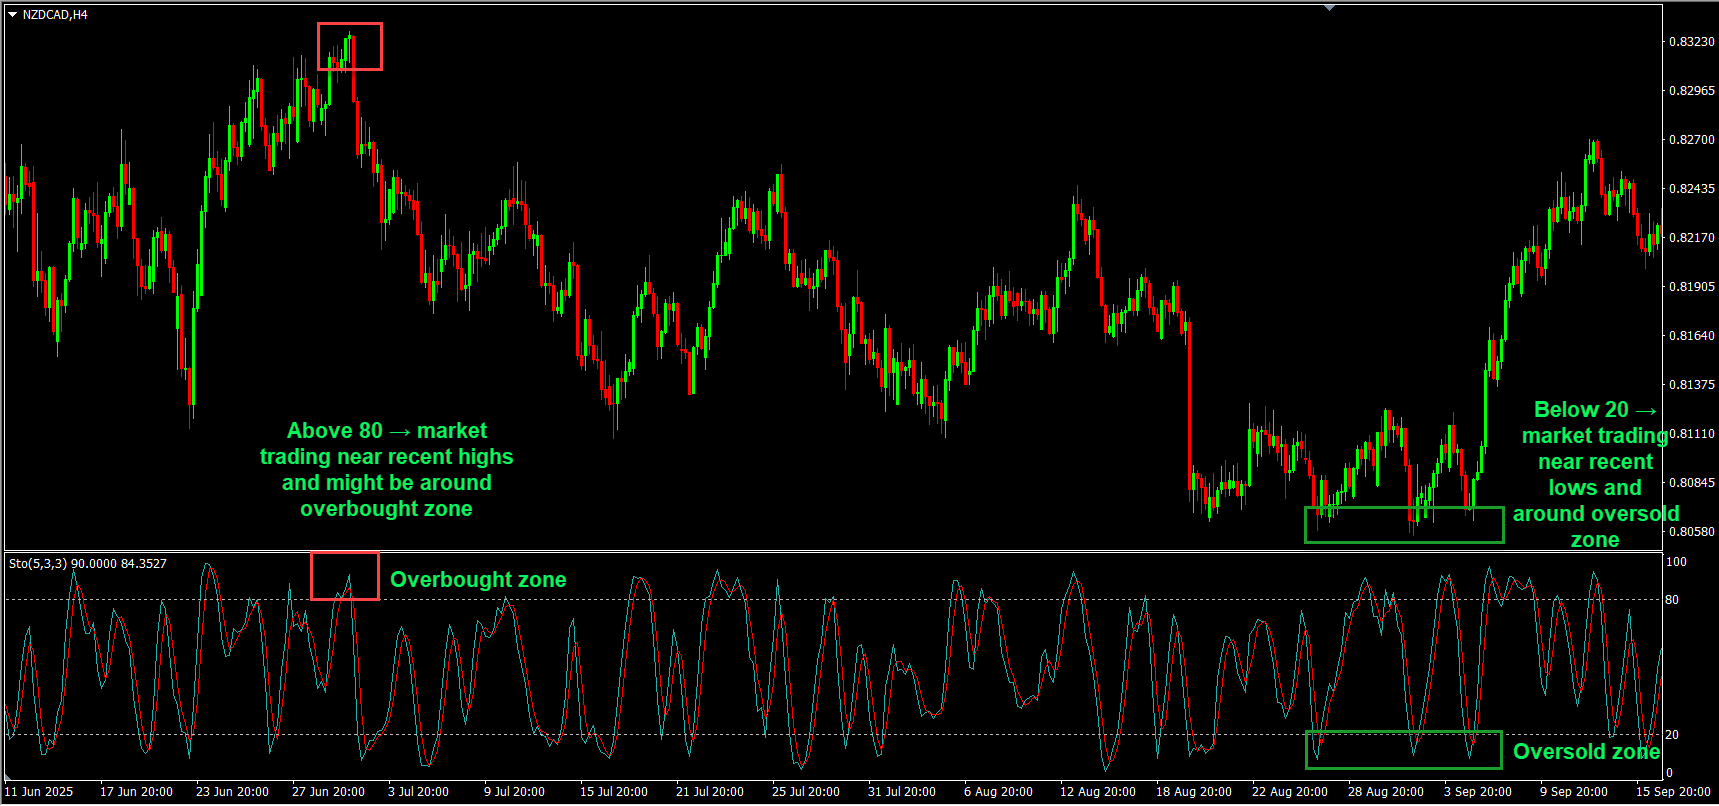
- Below 20 → market trading near recent lows and might be around oversold zone
🔹 Using Stochastic Effectively
➤ Range Conditions
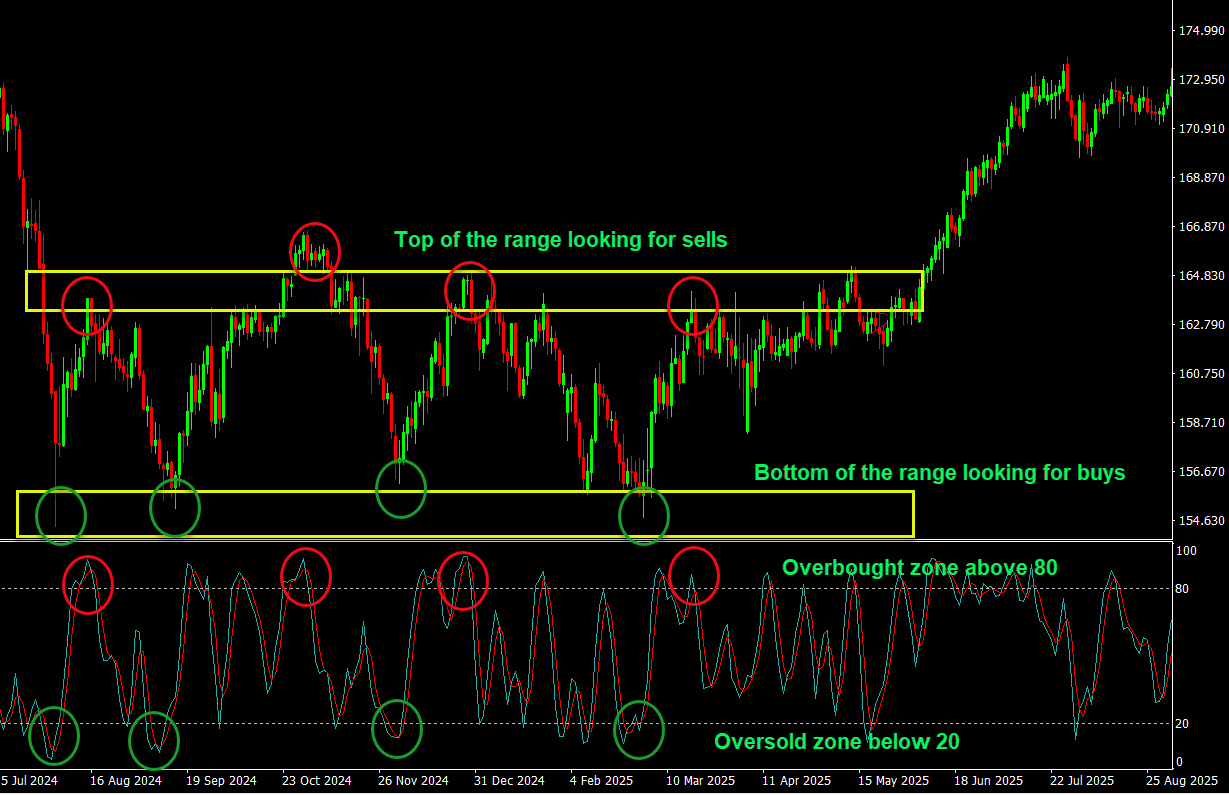
Stochastic works best in
sideways or corrective phases , highlighting potential pauses or reversals.
➤ Trend-Aligned Entries
In strong trends:
- Look for oversold signals after pullbacks in uptrends –
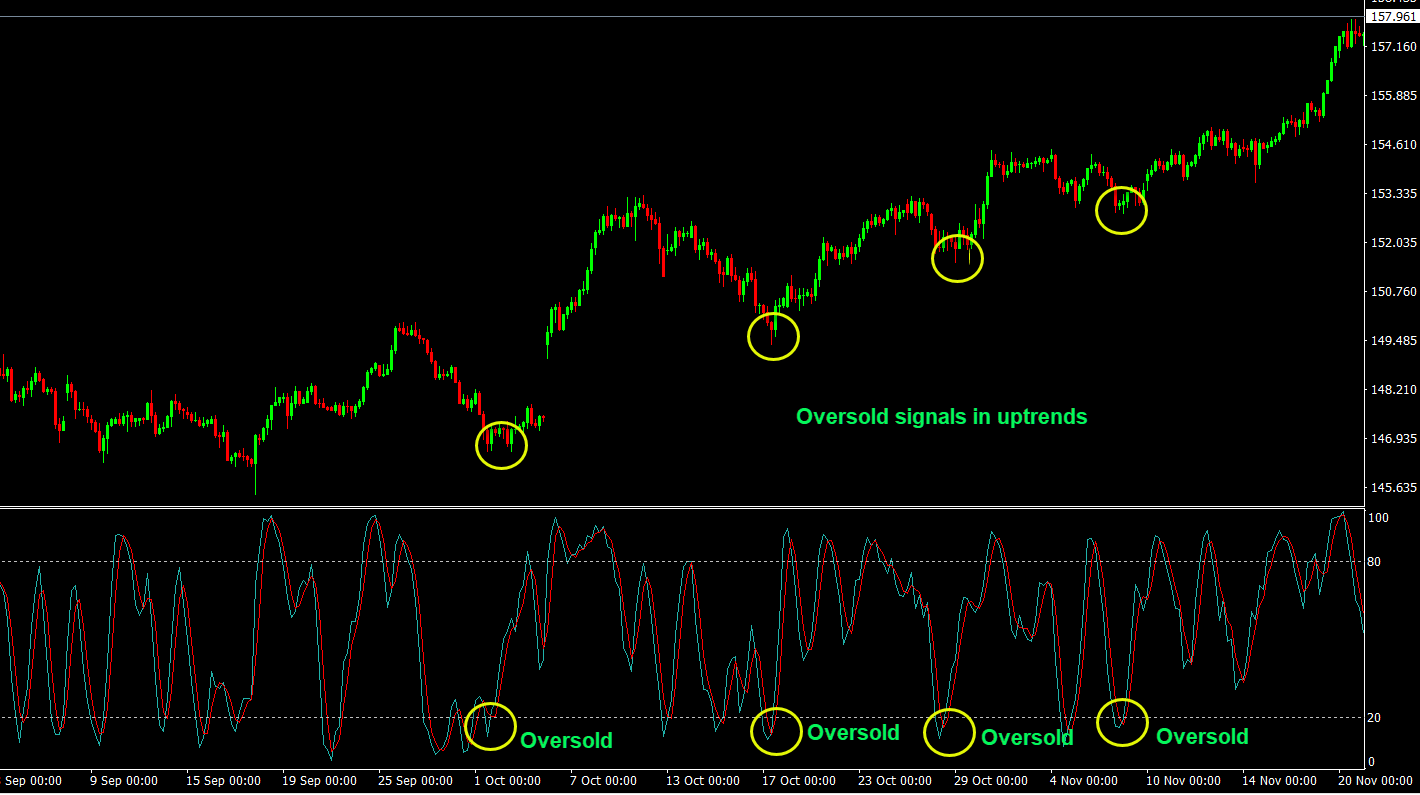
- Look for overbought signals after pullbacks in downtrends
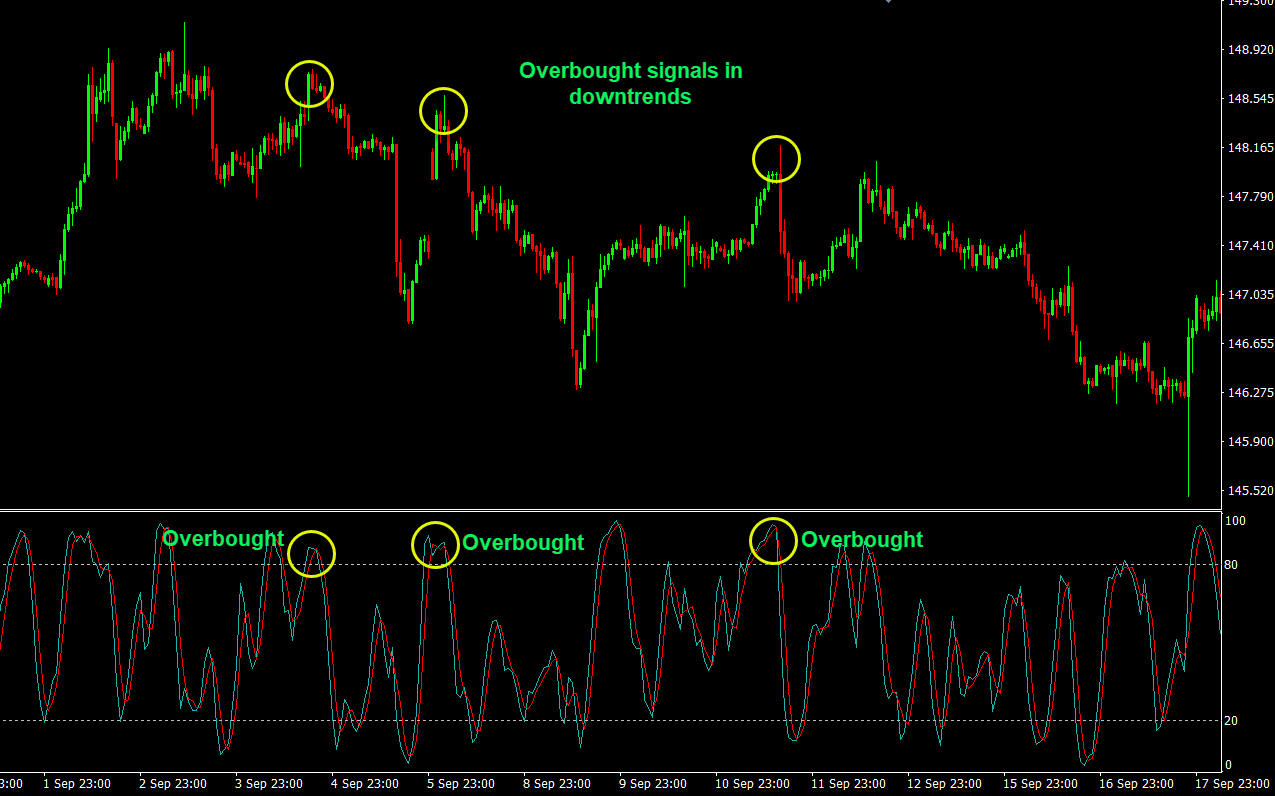
Never trade Stochastic against the dominant trend without confirmation.
4. How RSI, MACD, and Stochastic Work Together
Each indicator answers a different market question:
| Indicator |
Primary Purpose |
Focus |
| RSI |
Momentum strength |
Pressure balance |
| MACD |
Trend & momentum shifts |
Direction |
| Stochastic |
Price location |
Timing |
🔹 Combining for Higher Probability
- RSI confirms momentum bias
- MACD confirms trend direction
- Stochastic fine-tunes entry timing
Example workflow:
- MACD above zero confirms bullish market environment
- RSI holds above 50
- Stochastic oversold below 20 level
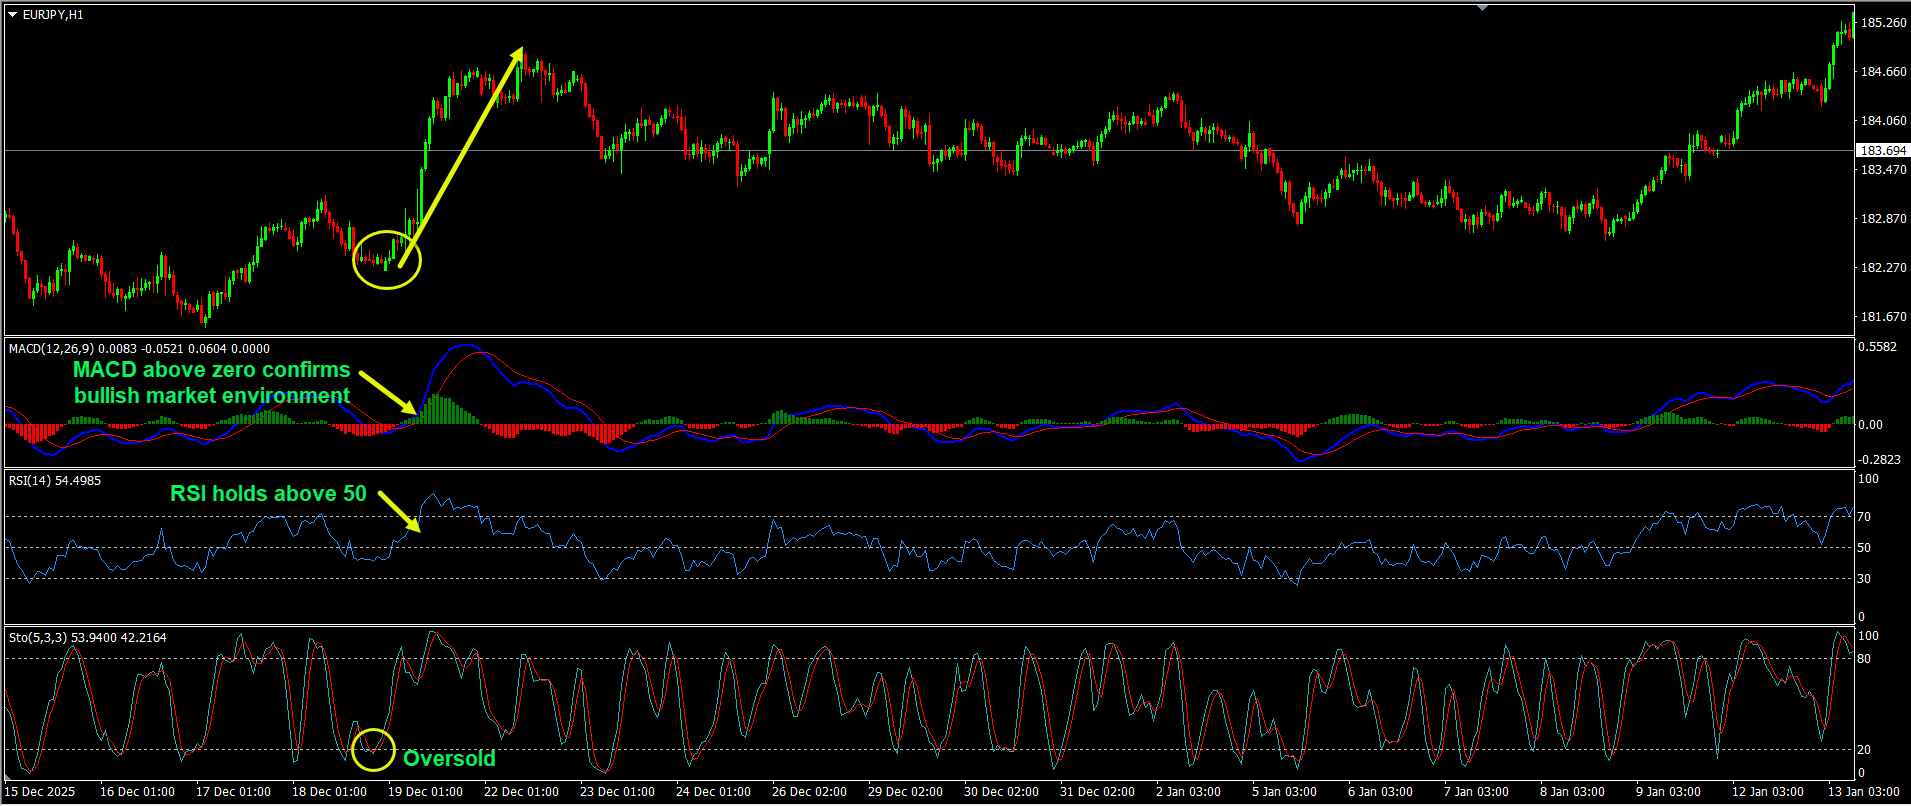
This alignment creates
structure-backed confidence , not random signals.
5. Common Mistakes Traders Make
❌ Treating Indicators as Predictions
Indicators reflect past price behavior — they don’t forecast the future.
Solution: Always combine indicators with market structure and price action.
❌ Ignoring Higher Timeframes
Lower-timeframe signals mean little without higher-timeframe context.
Solution: Define trend on H4 or Daily, or even Weekly first.
❌ Blindly Trading Overbought/Oversold
Extreme readings do not guarantee reversals.
Solution: Wait for confirmation through price action.
6. Final Perspective
RSI, MACD, and Stochastic are not trading systems — they are
decision-support tools .
Used correctly:
- RSI reveals momentum health
- MACD clarifies trend strength and shifts
- Stochastic highlights timing opportunities
When aligned with structure, risk management, and discipline, these indicators help build
consistency — not guesswork .