 If you’ve ever wondered why the price often pauses, pulls back, or reverses near certain levels — even without obvious support or resistance — then Fibonacci retracements are worth your attention.
This tool doesn’t predict the future.
Instead, it helps you observe how price often behaves in relation to human decision-making, which is exactly what winning traders focus on.
In this article, we’ll cover:
If you’ve ever wondered why the price often pauses, pulls back, or reverses near certain levels — even without obvious support or resistance — then Fibonacci retracements are worth your attention.
This tool doesn’t predict the future.
Instead, it helps you observe how price often behaves in relation to human decision-making, which is exactly what winning traders focus on.
In this article, we’ll cover:
✔ What Fibonacci retracements are (in simple terms)
✔ Why they work in Forex
✔ How to draw and read them step-by-step
✔ How to use them in real trading
✔ Common mistakes and how to avoid them
Let’s get started.
🧠 What Are Fibonacci Retracements?
Fibonacci retracements are a set of horizontal lines drawn between a significant swing high and swing low. These lines represent key percentage ratios where price frequently pauses, reverses, or accelerates. The most commonly used Fibonacci levels are:➡ 23.6%
➡ 38.2%
➡ 50% (not technically Fibonacci, but widely used)
➡ 61.8%
➡ 76.4%
Think of these as potential pause zones —places where the market often reacts.
They aren’t magical, but they highlight areas where traders historically pay attention, so you can use them to make smarter decisions.
📍 How to Draw Fibonacci Retracements
Drawing Fibonacci retracements properly is crucial. Here’s a simple step-by-step:🟢 Step 1 — Identify a Clear Trend Move
First, find a significant impulse leg — a clear directional move.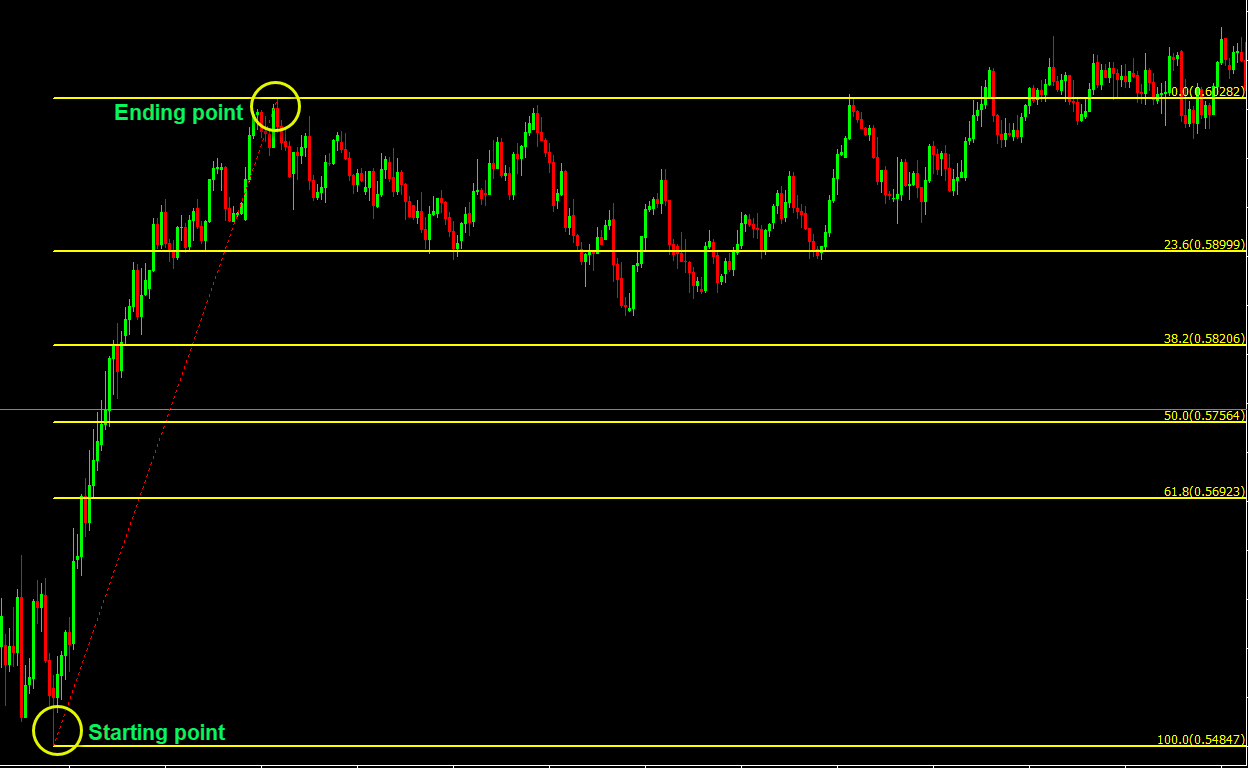
👉 For an uptrend: start from the swing low and draw to the swing high.
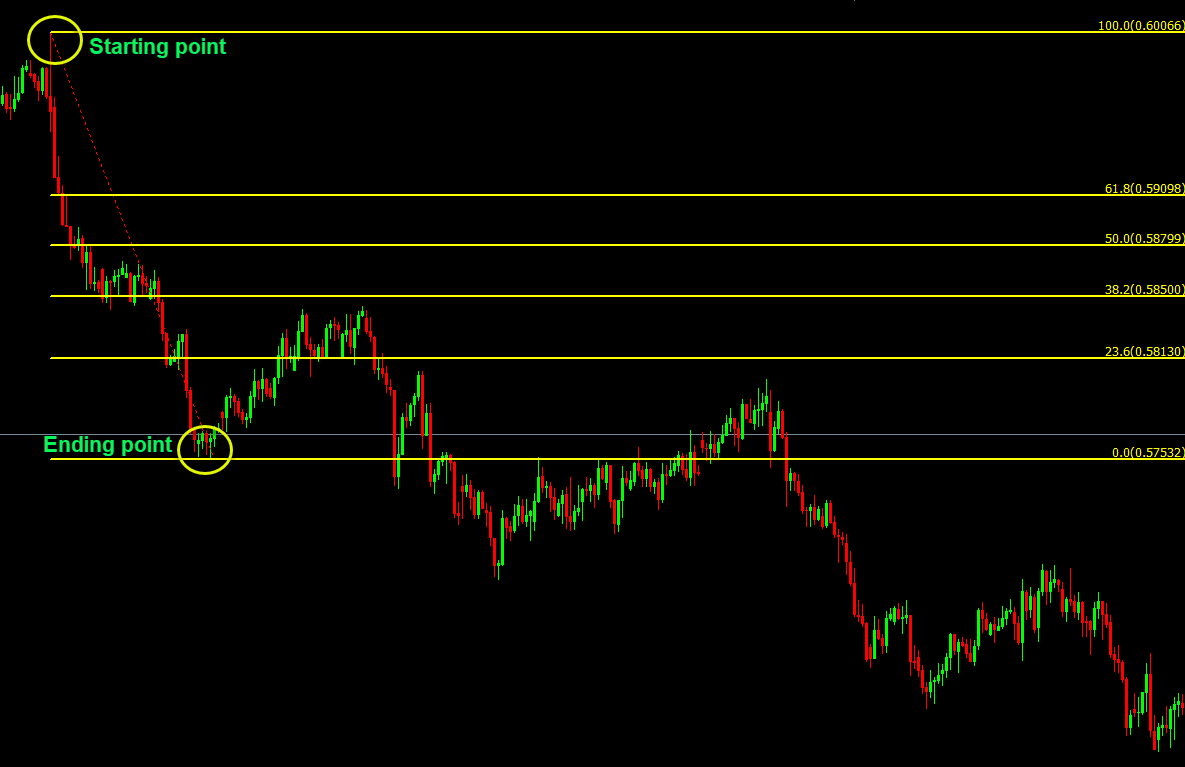
👉 For a downtrend: draw from the swing high down to the swing low.
This captures the full move you want to analyze.
🔵 Step 2 — Apply Fibonacci Levels
Your charting platform (like MT4, TradingView, etc.) will generate horizontal lines at the key Fibonacci percentages:✔ 23.6%
✔ 38.2%
✔ 50%
✔ 61.8%
✔ 76.4%
These levels often act as support or resistance and become potential retracement zones — areas where price might pull back before continuing in the trend direction.
🟡 Step 3 — Watch Price Reaction
Price often interacts with Fibonacci levels like:✔ Support in an uptrend
✔ Resistance in a downtrend
✔ Temporary stalls
✔ Bounce zones
The key is to observe price behavior around those lines — not just the lines themselves.
🧩 Why Fibonacci Levels Work
Fibonacci numbers come from pure math, but in trading markets are driven by people, algorithms are programmed by people, and institutions are reacting to people, as simple as that. Traders, institutions, algorithms — all participants use similar levels to:✔ Take profits in different stages
✔ Place stops at logical levels
✔ Add to positions
✔ Watch for reversals
So when enough traders are watching the same level, it becomes a self-fulfilling market response.
It’s not that the market must react there.
It’s that many traders expect it to — and their actions create the reaction.
🧠 How Traders Use Fibonacci Levels
Fibonacci retracements are versatile — they work in many ways. Here are the most effective practical uses:🟢 1. Pullback Entry Zone
In a strong trend, price often retraces to a Fibonacci level before resuming. Example in an uptrend: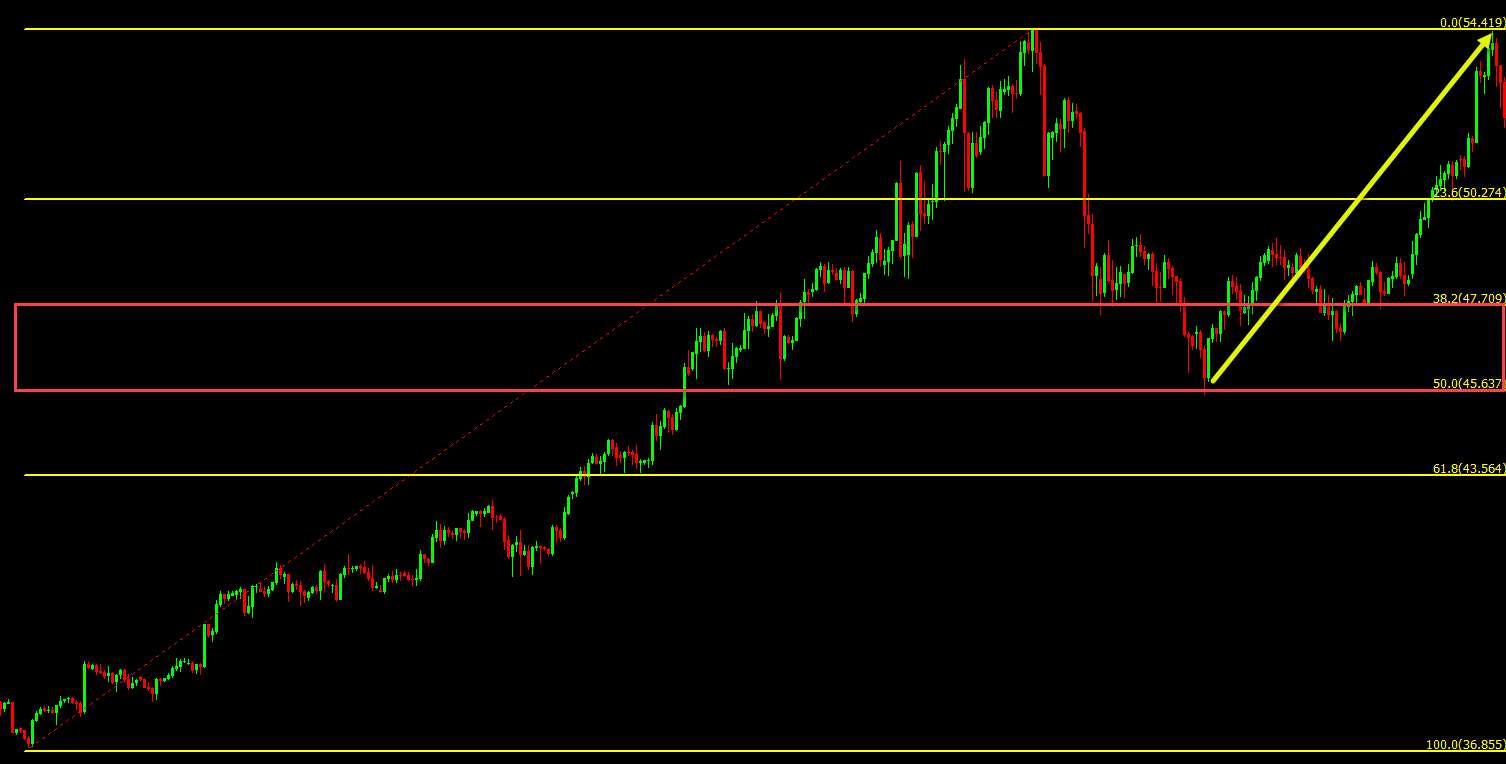
✔ Price rallies
✔ Pulls back to 38.2% – 50% levels
✔ Then continues upward
This can become a high-probability entry area because it aligns with both trend structure and retracement logic.
🔵 2. Confluence with Structure
Fibonacci levels become stronger when they align with other technical factors: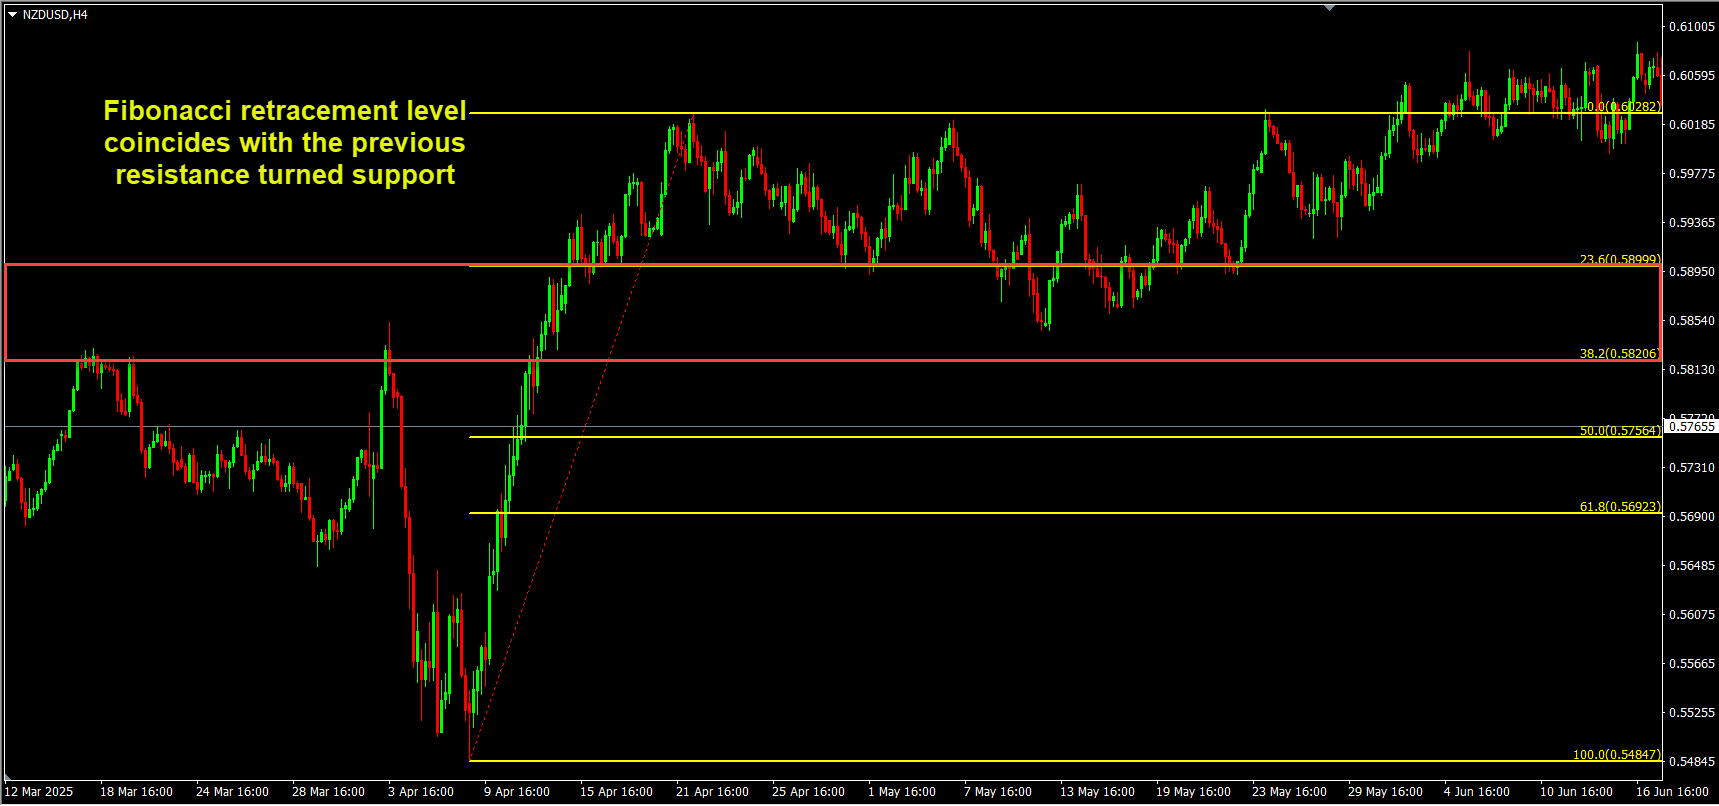
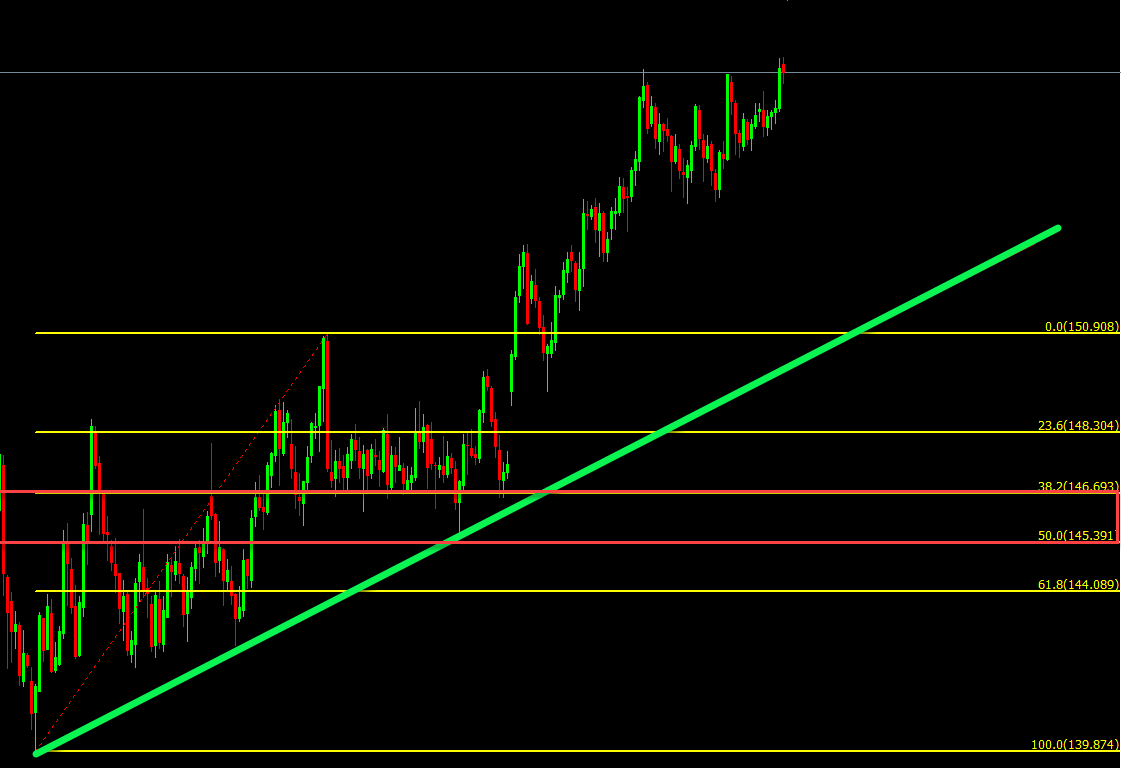
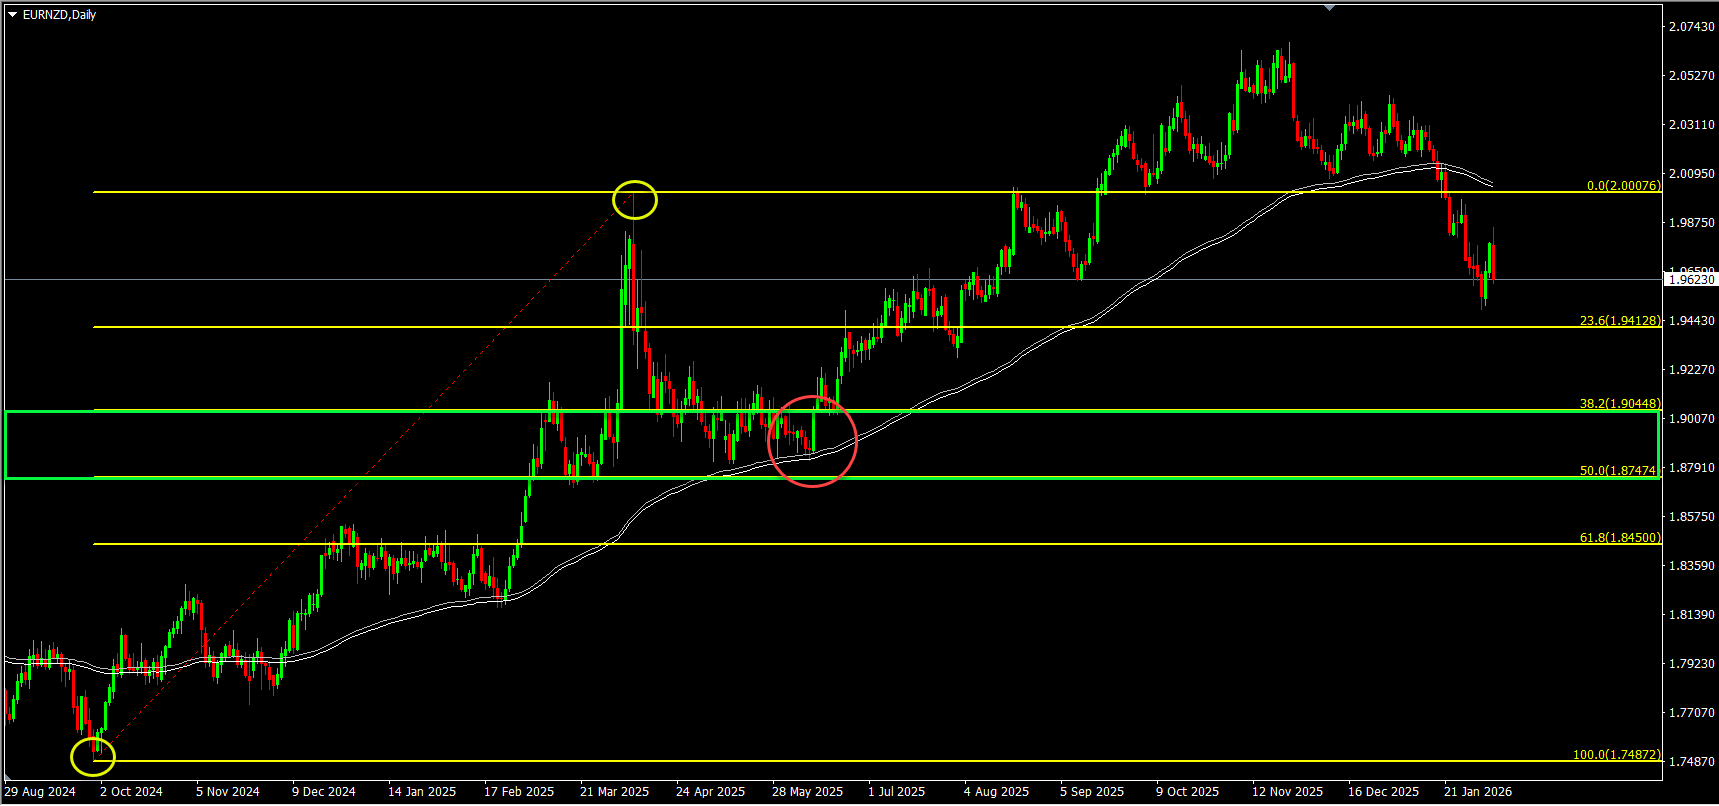
✔ Previous support/resistance
✔ Trendlines
✔ Moving averages
Where Fibonacci meets these additional levels — that’s often a decision zone.
Multiple signals converging on one area increase the odds of a relevant reaction.
🟡 3. Profit Targets
Instead of guessing profit levels, Fibonacci retracement levels can be used to identify realistic and structured profit targets. After a strong bearish or bullish move, traders plot the Fibonacci retracement and look to trade the pullback and often project profit targets toward the key retracement level, such as 38.2%, 50%, or 61.8%.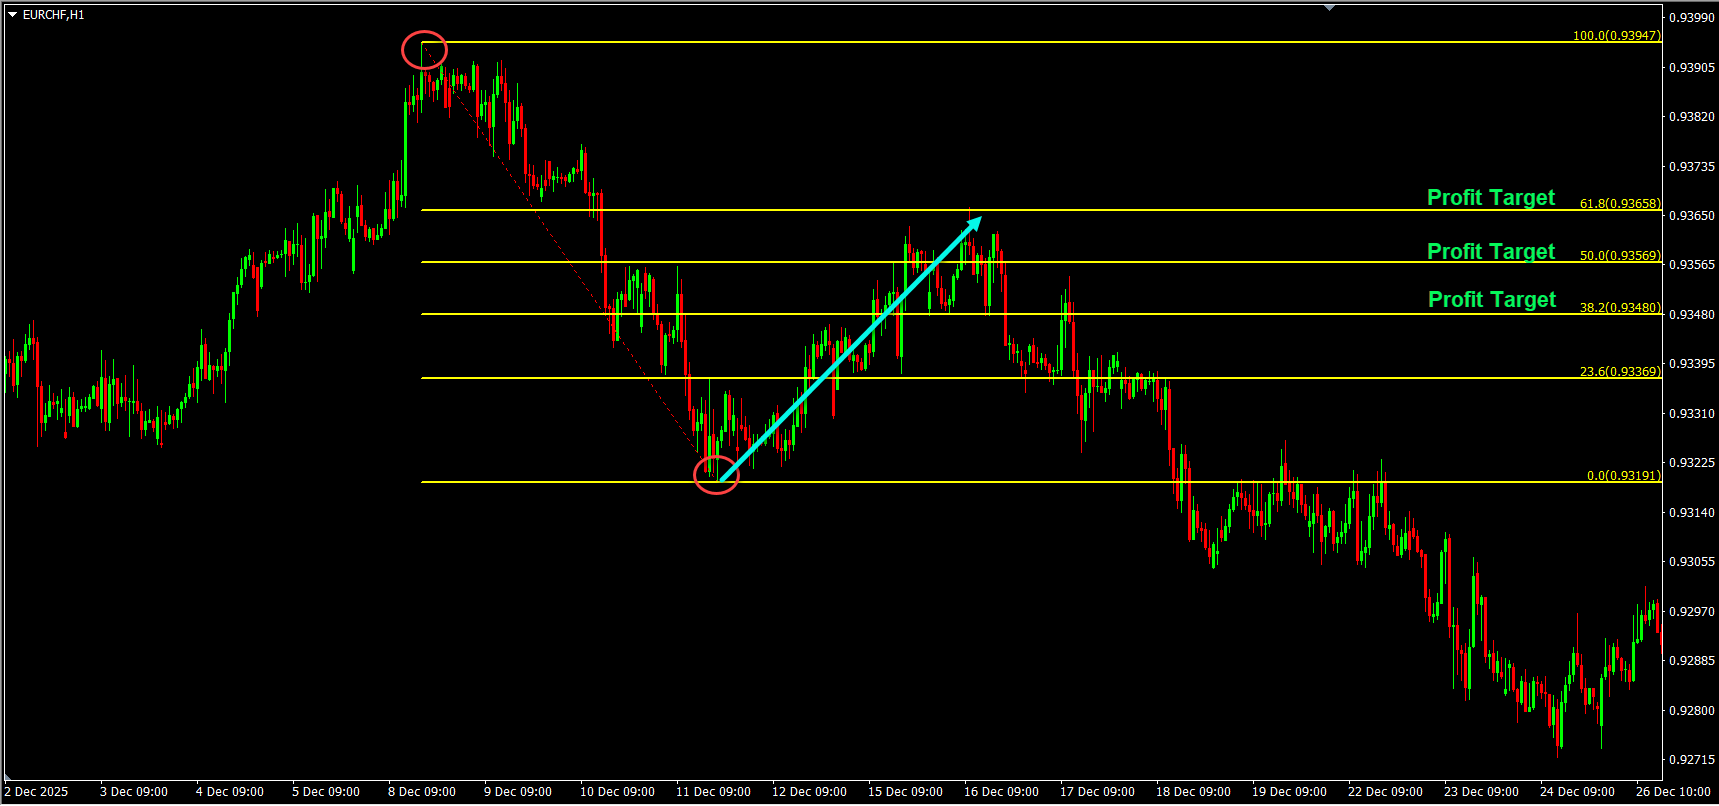
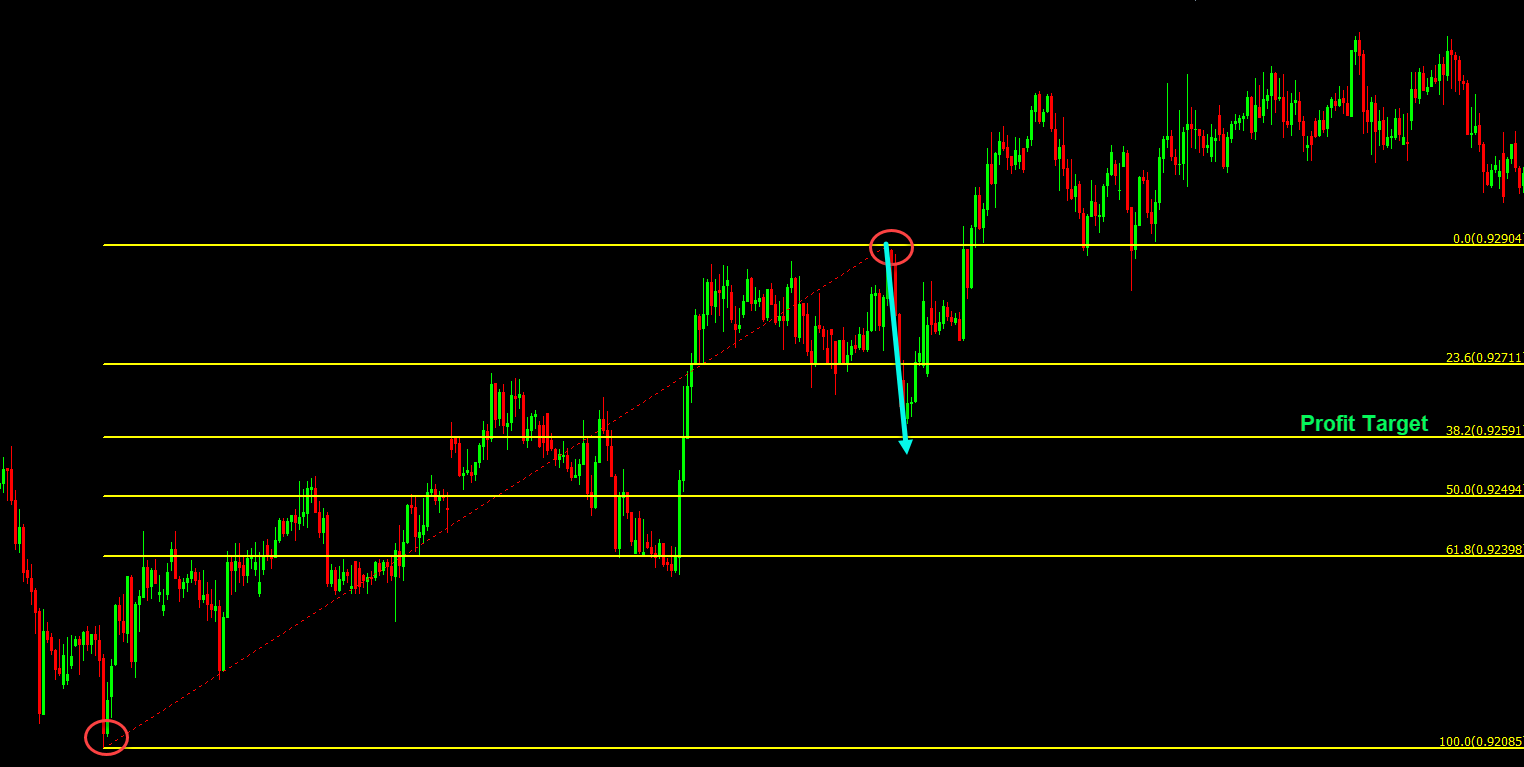 This way:
✔ You avoid exiting too early
✔ You don’t overstay and give back gains
Retracement helps define logical profit objectives.
📊 Combining Fibonacci With Price Action
Fibonacci levels are most powerful when reinforced with behavioral clues:Look for:
✔ Pin bars or rejection candles
✔ Bullish engulfing patterns or other strong Japanese candle patterns
✔ Support holding on multiple tests
✔ Rising volume at Fibonacci zones
When price reacts and shows conviction, you have stronger confirmation.
⚠️ Common Fibonacci Mistakes (And What to Do Instead)
Even good tools fail when used incorrectly. Here are frequent pitfalls:❌ Using Fibonacci Without a Clear Trend
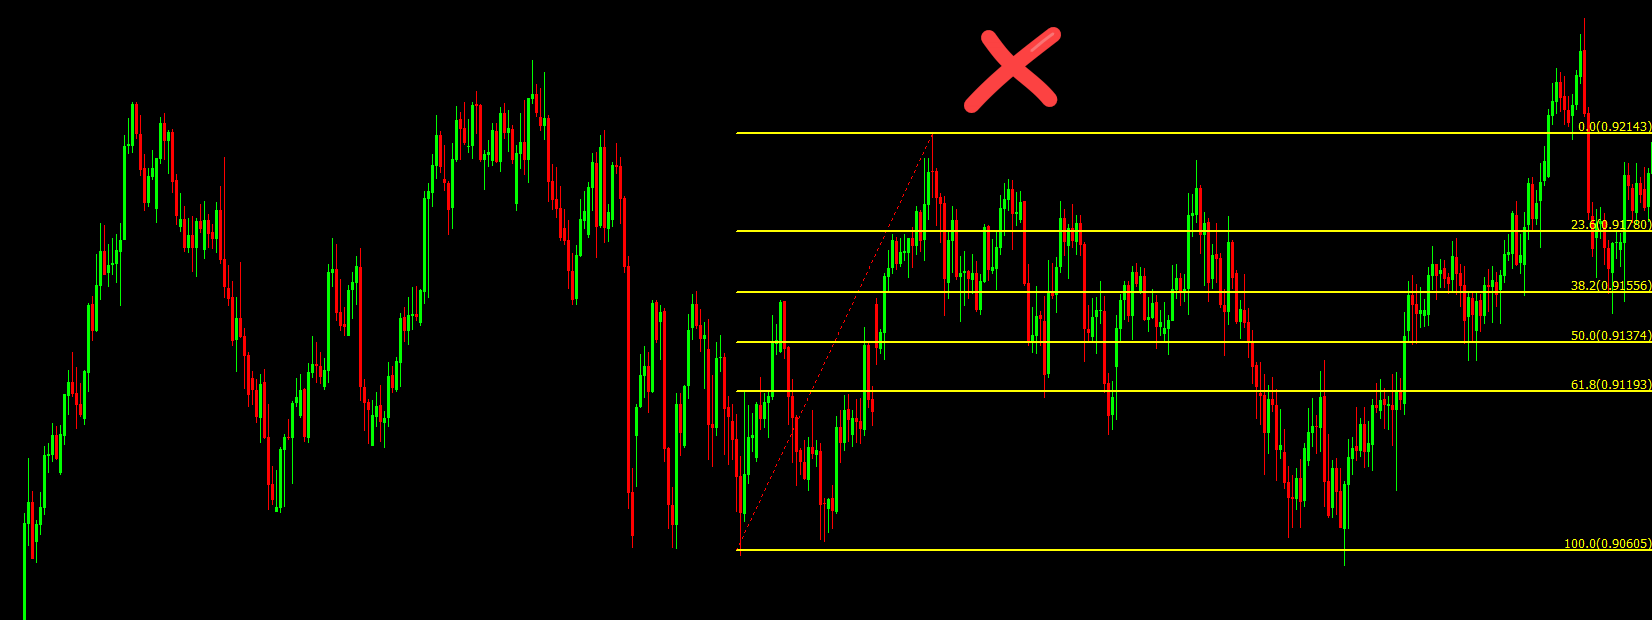 Don’t draw retracements in choppy, sideways markets.
➡ They have no reliable swing structure to measure.
Always base Fibonacci on a distinct directional move.
Don’t draw retracements in choppy, sideways markets.
➡ They have no reliable swing structure to measure.
Always base Fibonacci on a distinct directional move.
❌ Treating Levels as Rigid Targets
Fibonacci lines are zones, not exact prices. Price rarely stops exactly at 38.20% like a laser. Instead, expect some wiggle room around the level.❌ Ignoring Market Context
Levels alone won’t save you. You still need:✔ Trend confirmation
✔ Volume clues
✔ Price action validation
Fibonacci supports — it does not replace context.
A Practical Fibonacci Checklist
Before acting on a Fibonacci level, ask:✔ Is the trend clearly established?
✔ Have I drawn the swing high and low correctly?
✔ Does the price show a real reaction at the level?
✔ Is there confluence with other technical tools?
✔ Does my stop make sense based on recent structure?
✔ Do I have a plan for profit exits?
If the answer is “yes,” — you’re trading alignment.
If the answer is “maybe” — wait.
🧠 Final Thoughts: Fibonacci Is a Tool, Not a Magic Wand
Fibonacci retracements give you a mathematical grid of possible reaction areas, but they do not guarantee the price will behave perfectly at those lines. The real value comes from combining:✔ Trend clarity
✔ Price reaction
✔ Confluence signals
✔ Sound risk management
When all of these align, Fibonacci becomes a powerful decision lens — not a guessing game.
A tool works best when you understand why price often respects these levels, not just that it does.
Trade with structure, confirmation, and discipline — and Fibonacci becomes a dependable part of your toolkit.