If you imagine the Forex market as a big, rolling sea of prices — trending up, down, or sometimes choppy and flat — then trendlines and channels are your map and compass. They help you see the path the market is walking, where price tends to react, and when it might change direction. In this article, I’ll walk you through what trendlines and channels are, how to draw them right, how to trade using them — and ultimately, how to think like a trend-aware trader.
 When done right, trendlines become powerful reference lines — helping you see where price may return, bounce, or break out.
 This works well when the channel has been respected multiple times: price shows consistent respect to support and resistance rails.
What Are Trendlines — The Market’s Invisible Guiding Lines
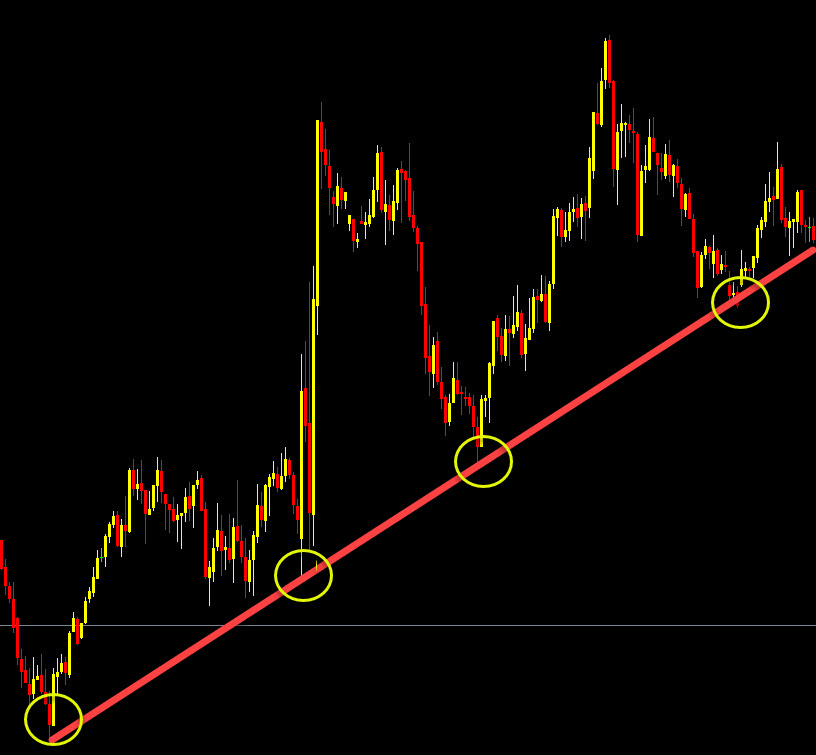
A trendline is simply a slanted (diagonal) line drawn on a price chart to connect a sequence of important price points — typically successive lows in an uptrend or successive highs in a downtrend. This gives you a dynamic support or resistance line.- In an uptrend, a trendline is drawn under the price — connecting rising lows (higher lows). That line acts as a rising support line.
- In a downtrend, you draw the line above price — connecting descending highs (lower highs), giving you a descending resistance line.
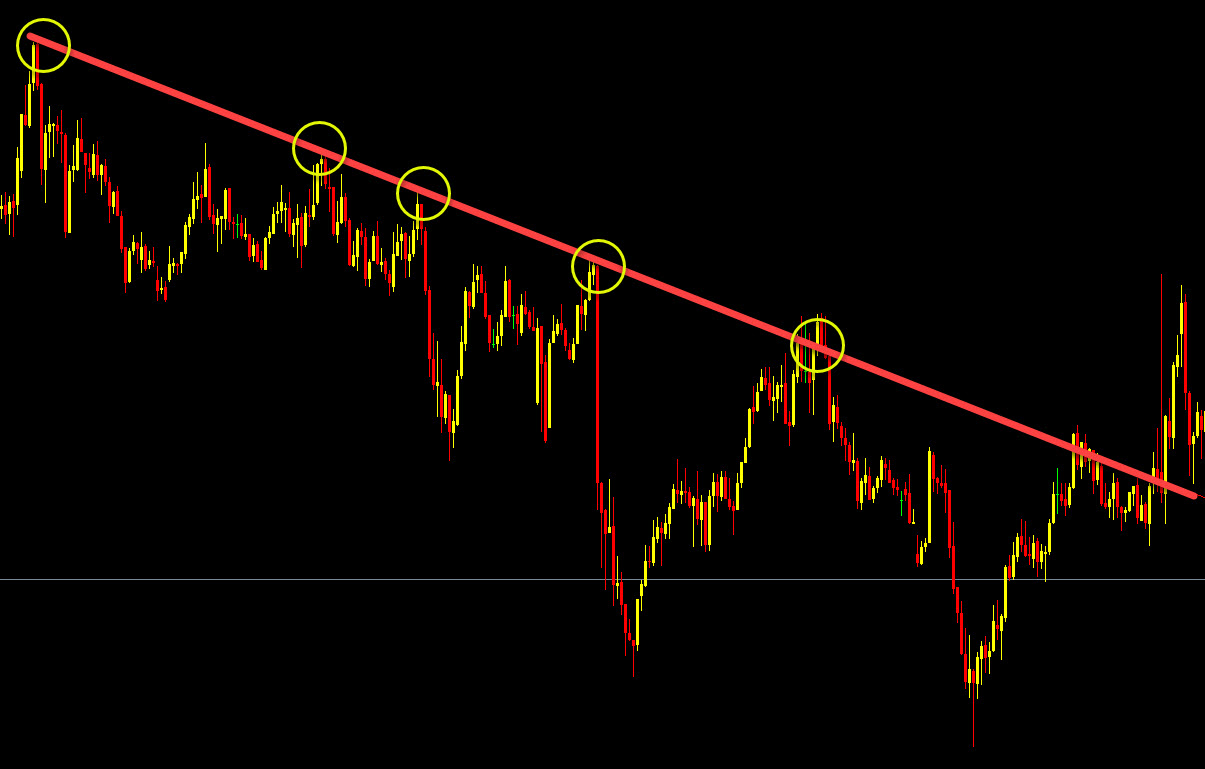
- They show market bias: rising trendline = market leaning bullish; falling trendline = bearish.
- They act as dynamic support/resistance: price often bounces off them rather than moving randomly.
- They let you visualize momentum: if price respects the trendline multiple times, it signals a kinder, steadier trend than one that overshoots wildly.
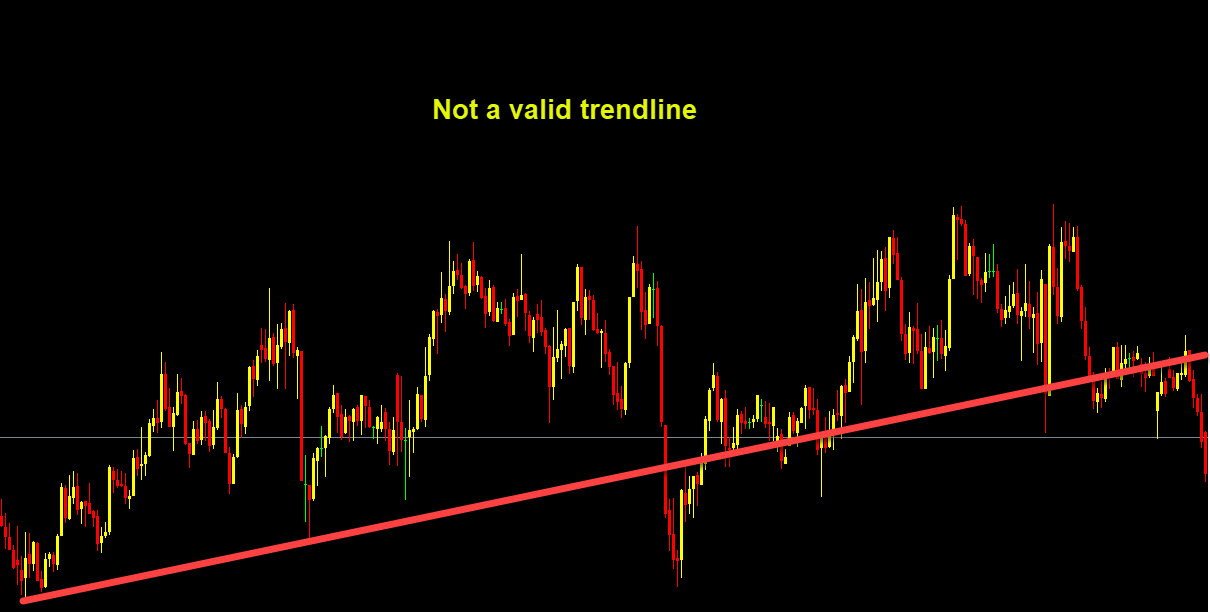
Drawing Trendlines Properly — The Right Way to Do It
Because trendlines are subjective (it’s humans drawing lines, not robots), there are good practices that separate useful trendlines from misleading ones. Here’s how to draw them like a pro:- Pick the right timeframe — generally, higher is better.
- Zoom out and connect major swing points (not every small wiggle).
- Don’t force the trendline to fit — look for natural alignment.
- Prefer quality touches over quantity.
- Confirm that the trendline respects candle bodies (or wicks) reasonably.
When done right, trendlines become powerful reference lines — helping you see where price may return, bounce, or break out.
Introducing Channels — Trendlines 2.0: A Corridor for Price
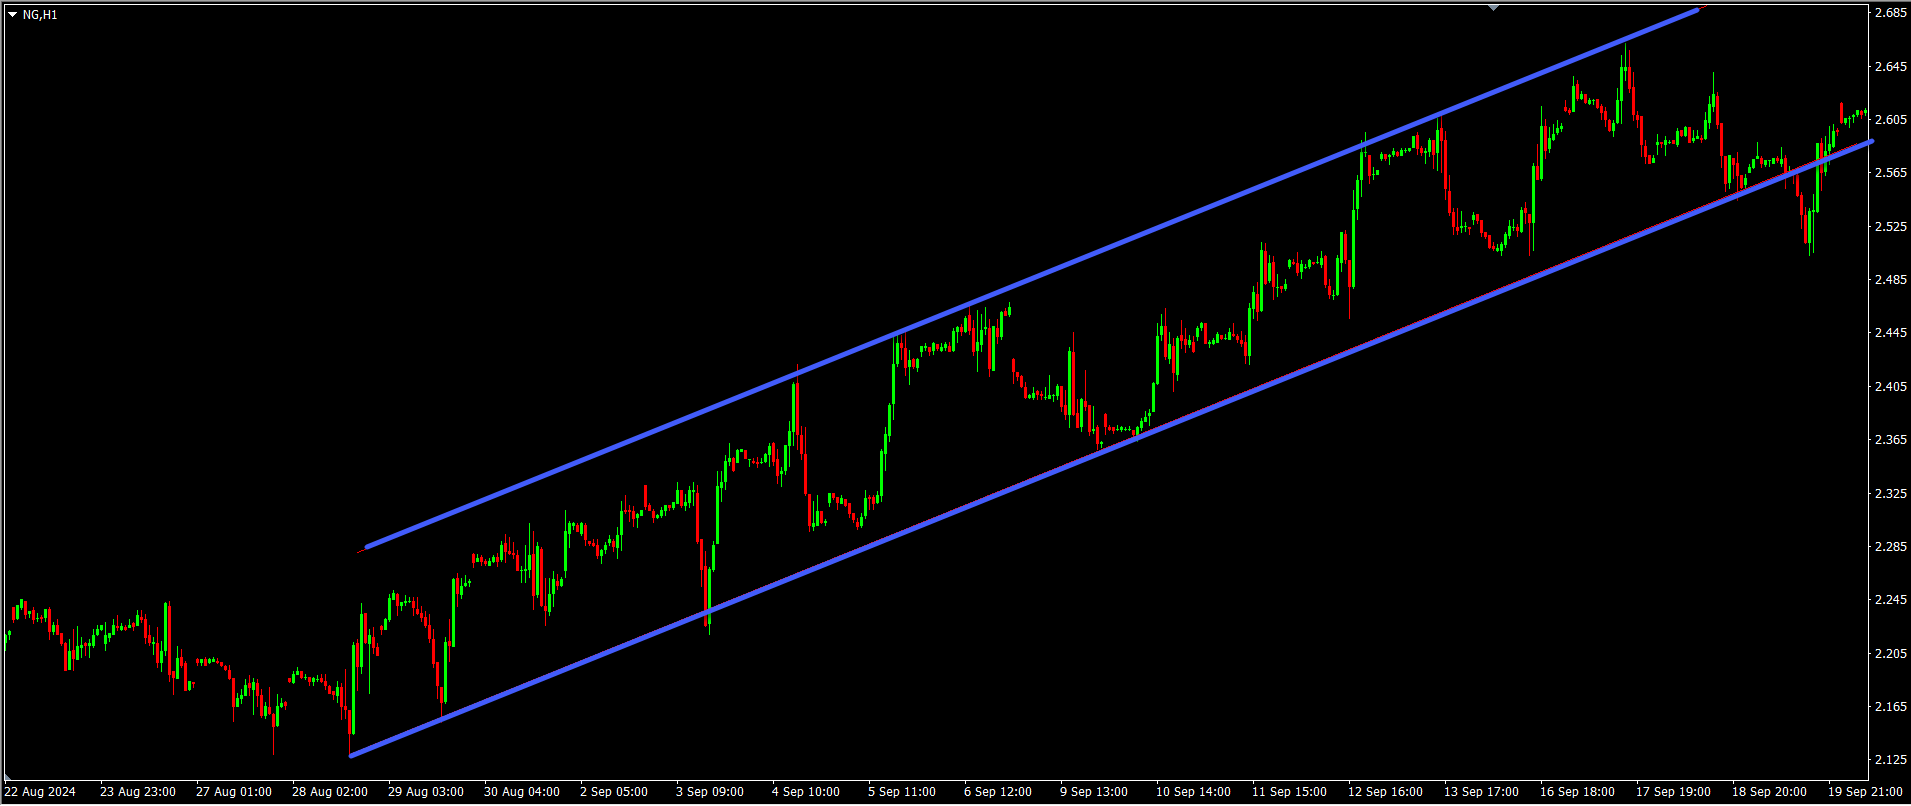
A channel (often called trend channel / price channel) builds on the concept of a trendline by adding a second, parallel line on the opposite side of the price action — creating a corridor/band where price moves between support and resistance. Depending on slope and direction, you get different types of channels:- Ascending (Upward) Channel — bullish trend within a rising corridor.
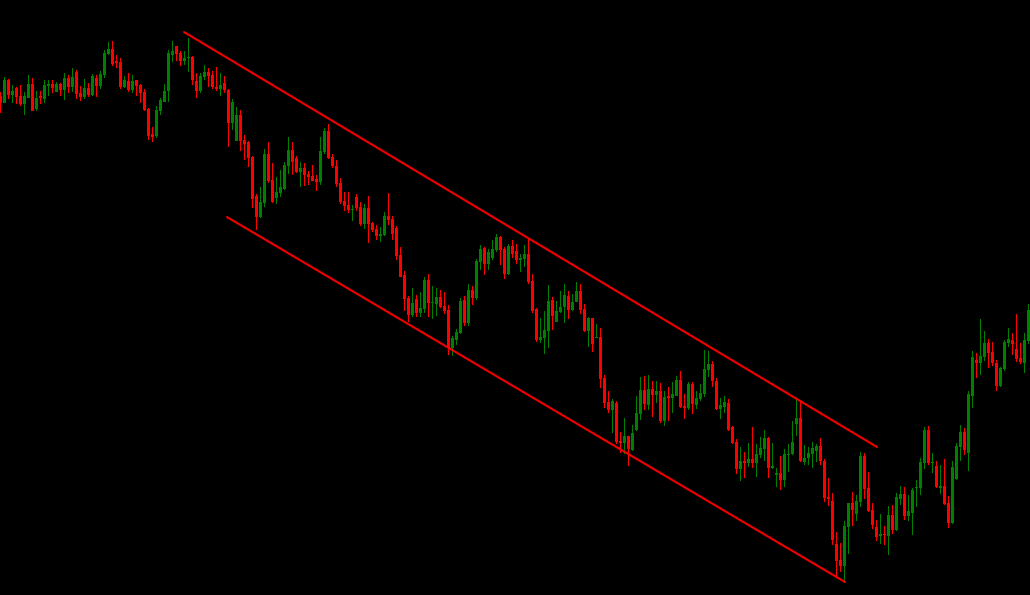
- Descending (Downward) Channel — bearish trend inside a downward sloping corridor.
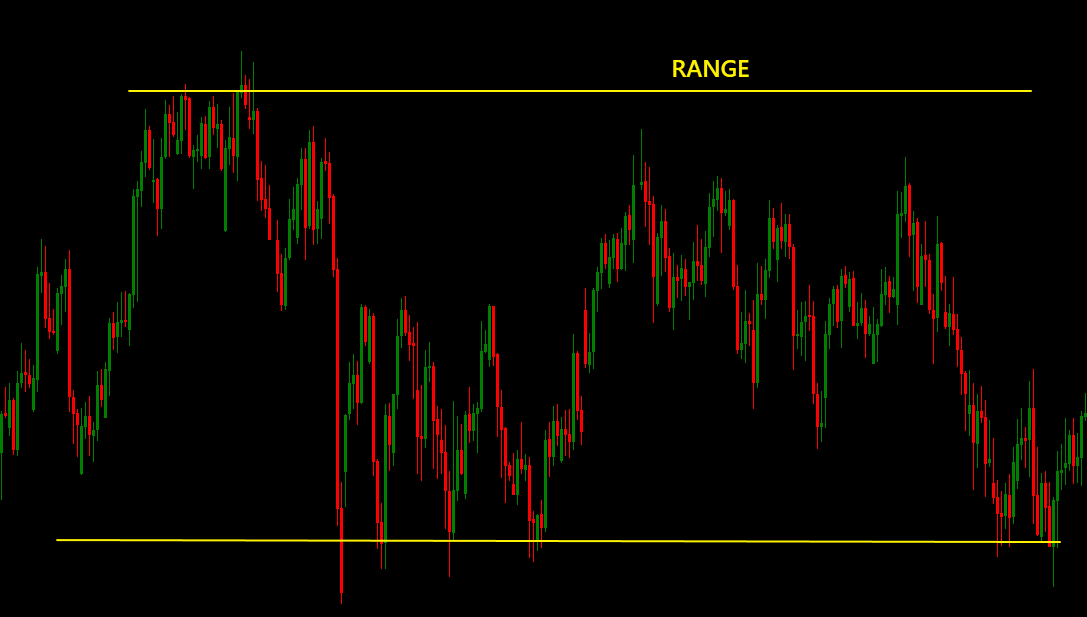
- Horizontal / Sideways Channel — price bouncing between two roughly horizontal lines: this reflects a ranging or consolidating market.
Why Use Channels & Trendlines — What They Bring to Your Trading Table
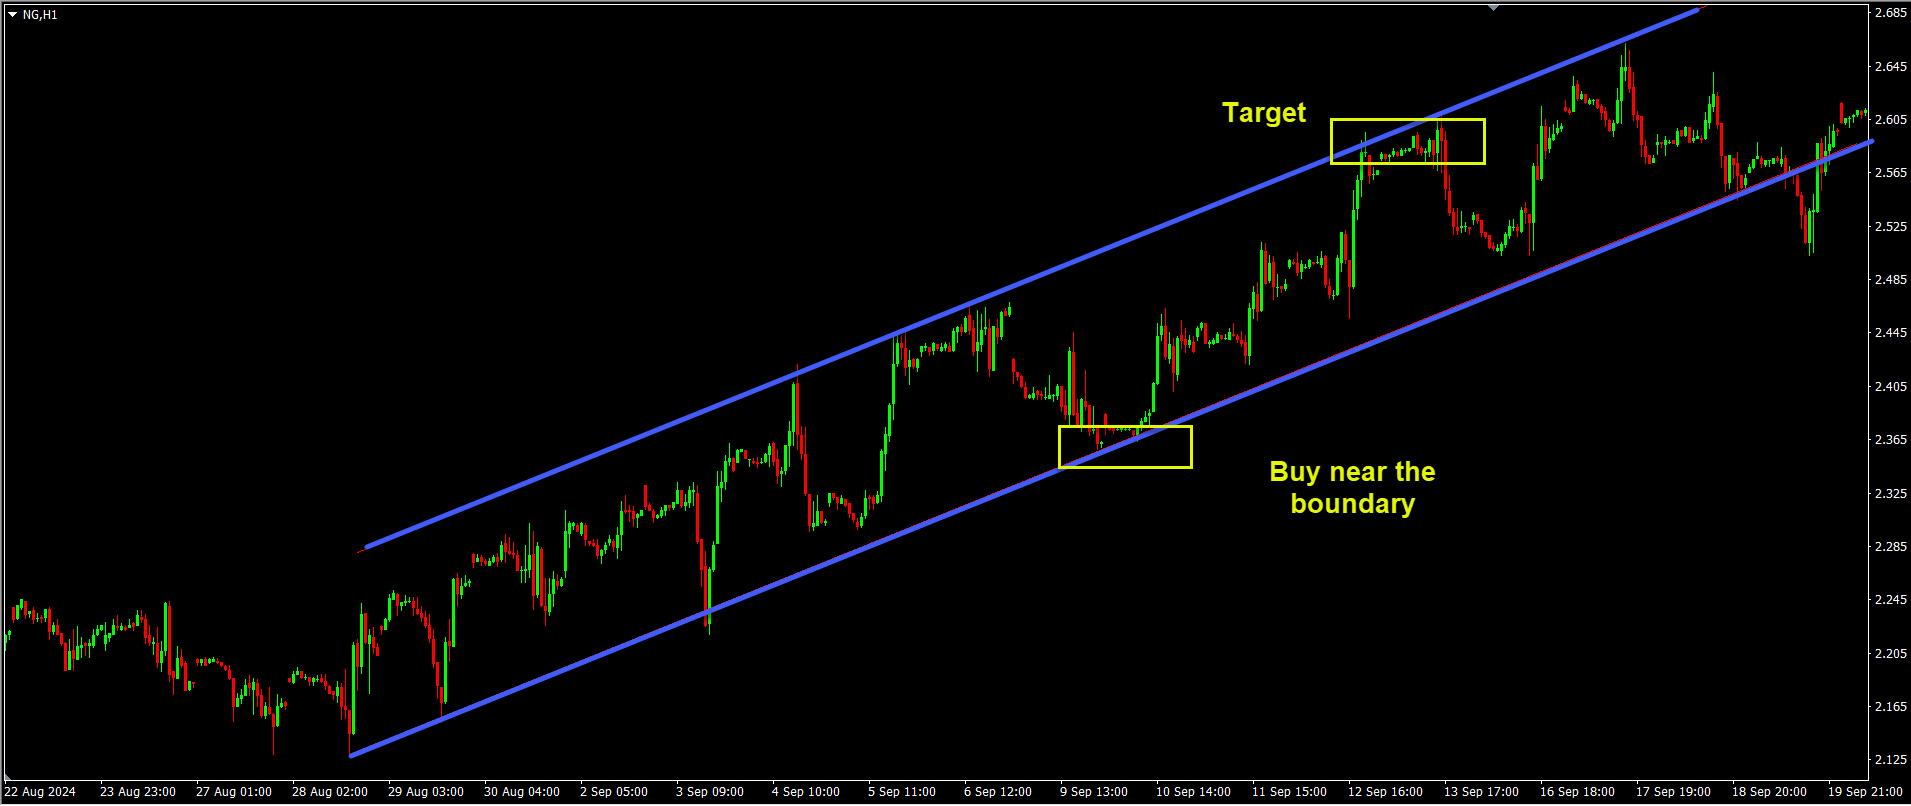
Using trendlines and channels is not just chart decorating — they offer real trading advantages:- Clear zones for entries and exits: In a rising channel, you might buy near the lower boundary (support) and target the upper boundary (resistance). In a down channel, you sell near the top and aim for the bottom.
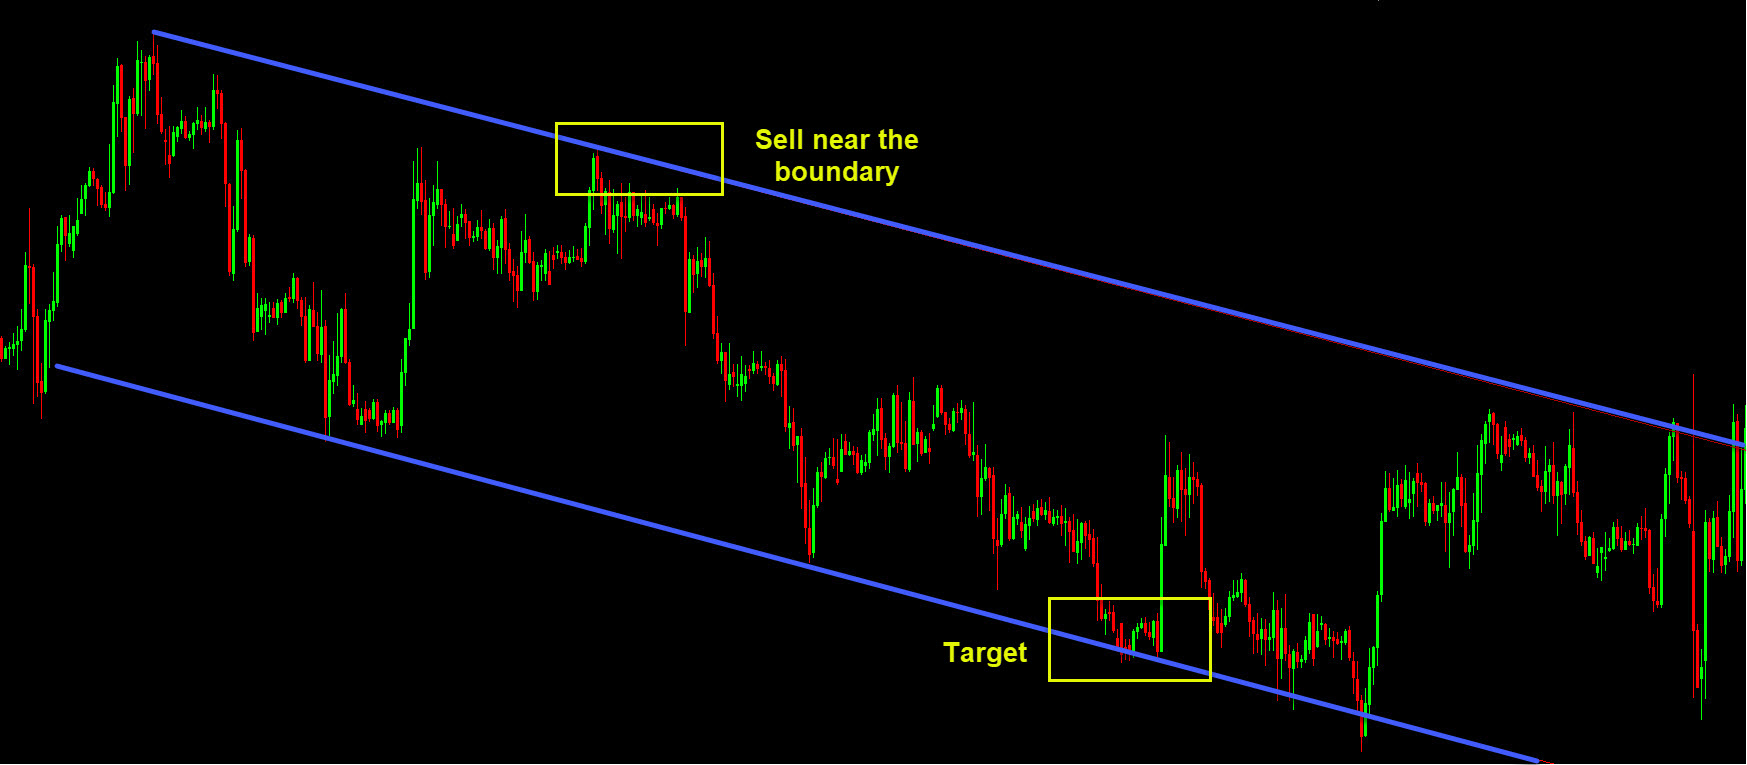
- Objective framing of price action: Rather than guessing where price may go, you use the channel boundaries as your guide — making trading less emotional, more systematic.
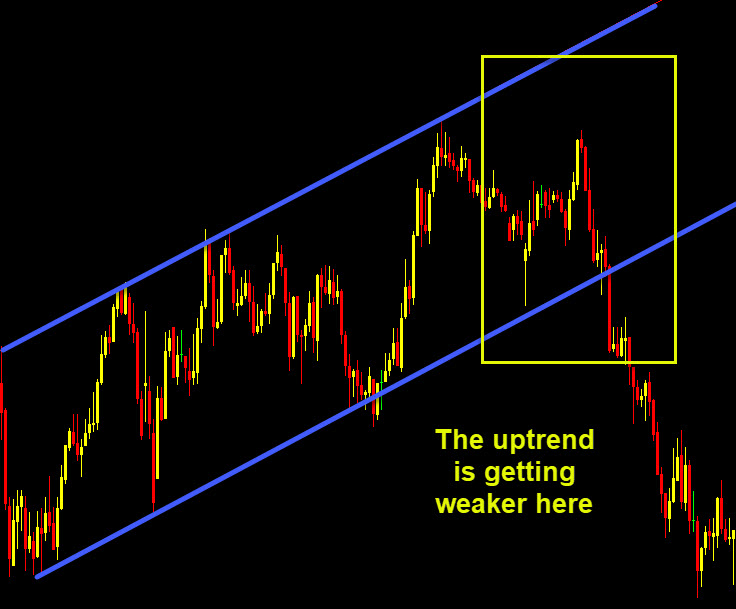
- Spotting trend strength or weakness: If price begins to wiggle, cut through the lower boundary, or fails to reach the upper boundary, it may hint that the trend is weakening or about to end.
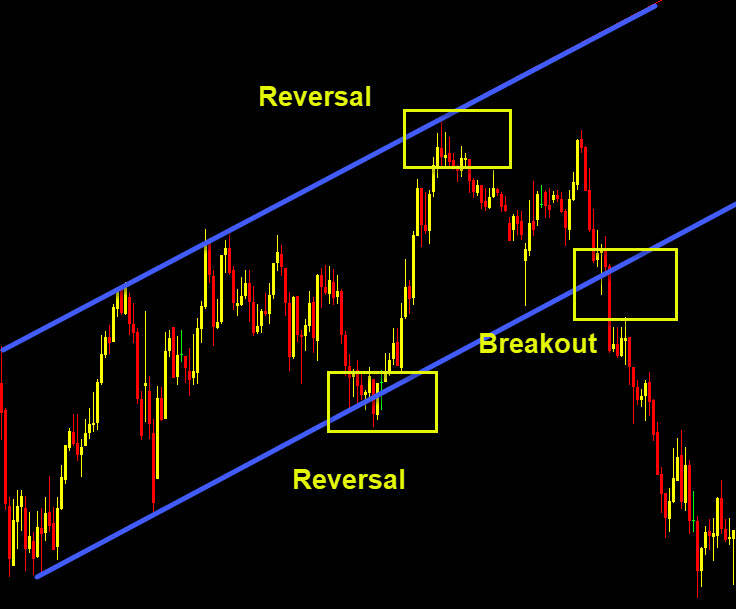
- Planning for breakouts and reversals: A channel breakout (price piercing through upper or lower line) can signal a new strong move. Conversely, a bounce from the boundary may offer lower-risk reversal trades.
How to Trade with Trendlines & Channels — Simple Strategies
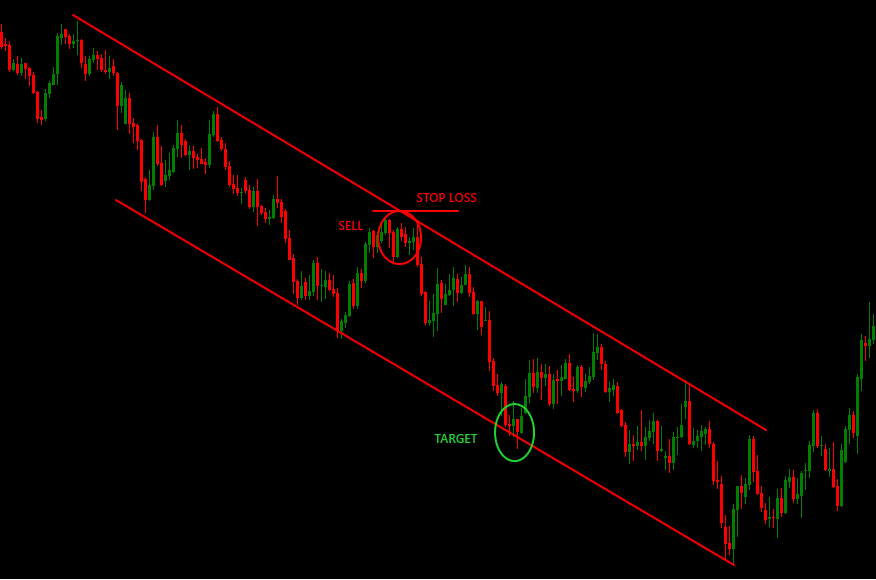
Here are a few practical ways to use trendlines and channels when trading Forex (or any other asset):🔹 Strategy A: Bounce Trades (Channel-Respecting)
- Wait for price to reach the lower boundary (in an up channel) — look to enter a buy trade.
- Place a stop-loss slightly below the boundary (to avoid false breaks).
- Target profits near the upper boundary.
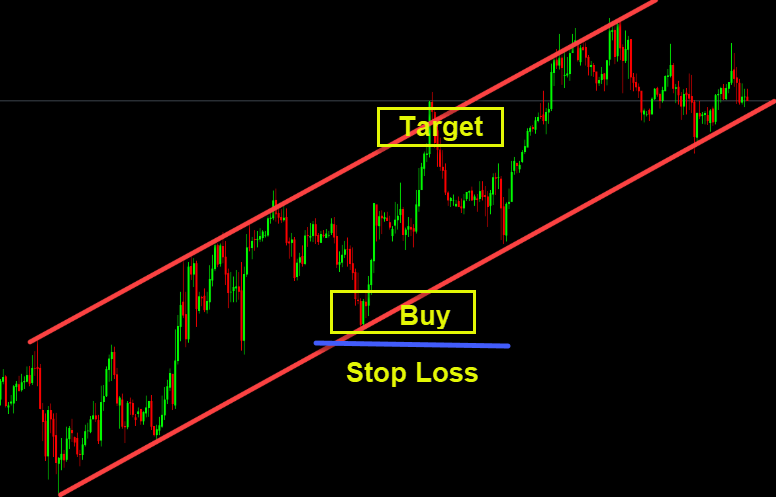
This works well when the channel has been respected multiple times: price shows consistent respect to support and resistance rails.
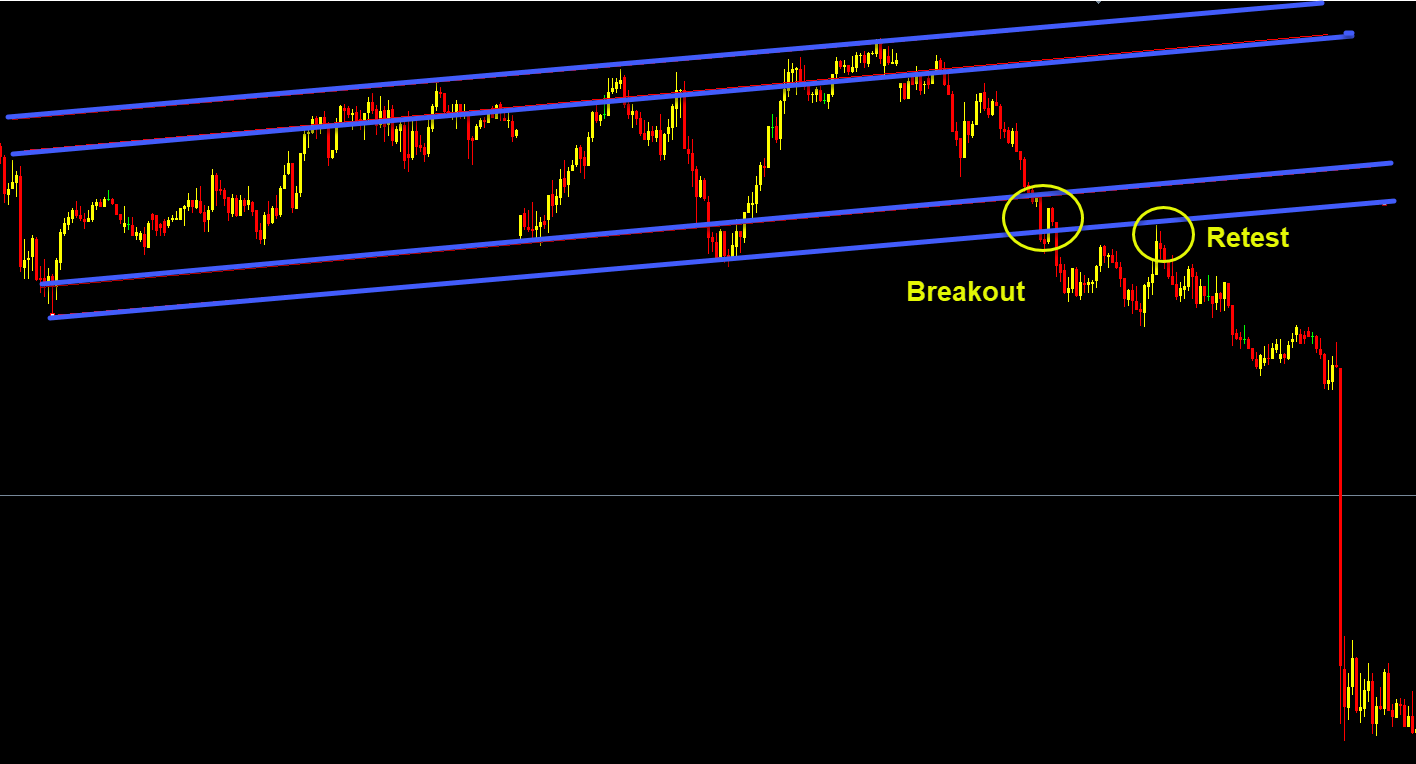
🔹 Strategy B: Breakout Trades
- Watch for price to break and close beyond the channel boundary (upper or lower).
- Wait for a retest of the broken boundary (price comes back to test it from the other side).
- If the retest holds (support becomes resistance or vice versa), enter with trend direction (breakout).
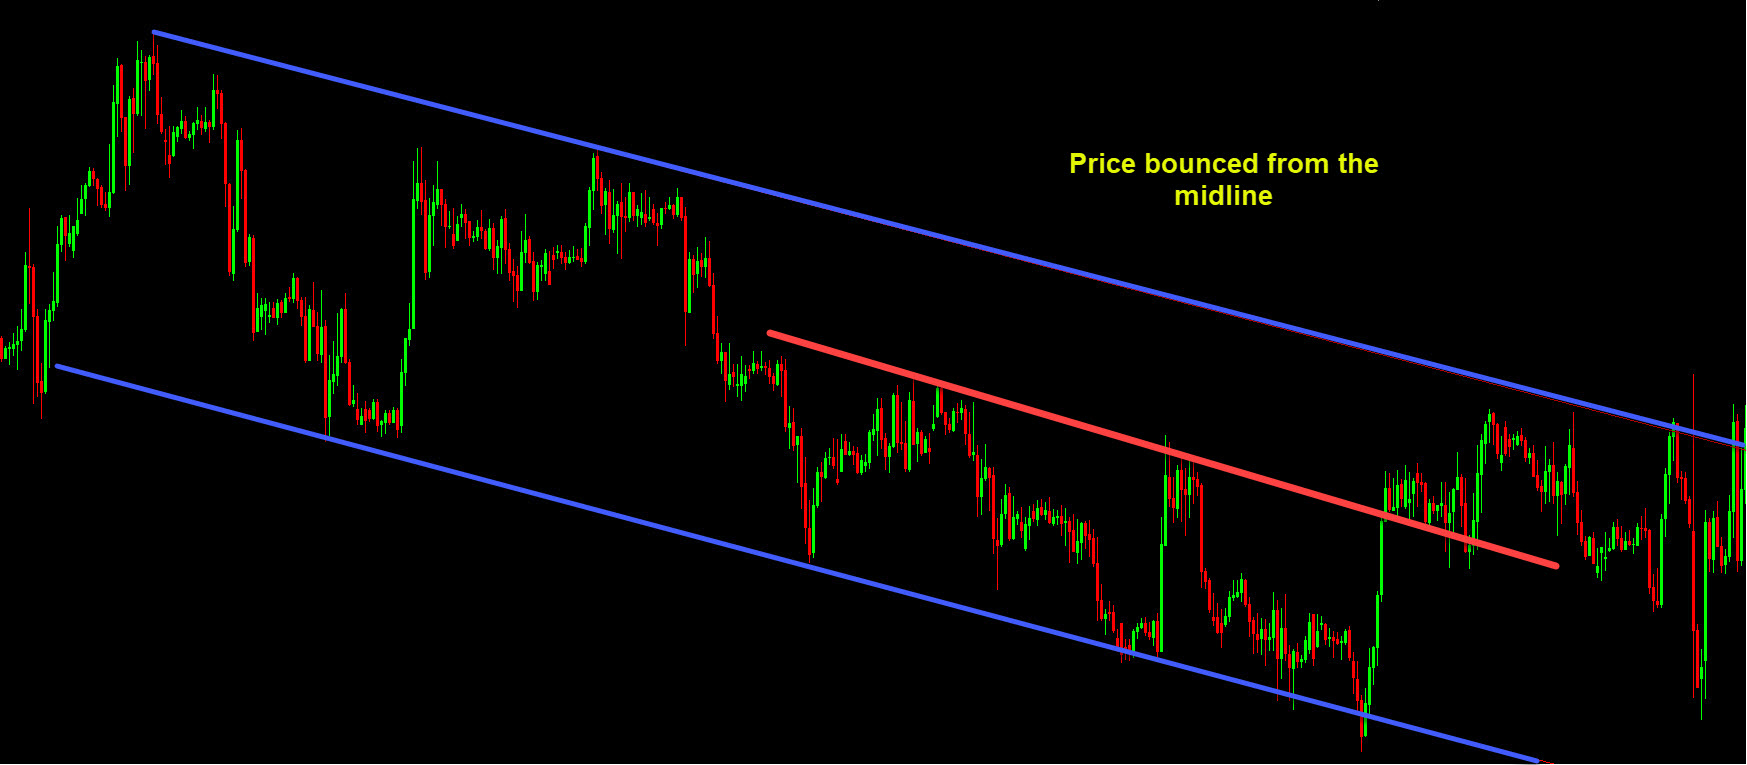
🔹 Strategy C: Midline / Channel-Zone Trading (for wide channels)
- For very wide channels, occasionally the price may bounce at the midline (halfway between upper & lower rails).
- This can be used for partial profit taking, or as conservative entry/exit zones inside the channel.
🔹 Multi-Timeframe Confirmation
- Draw your channels on a higher timeframe (e.g. Daily) to get the “big picture.”
- Then zoom into a lower timeframe (e.g. 4-hour) for fine-tuned entries/exits — but only if high-timeframe channel still holds.
Thinking Like a Channel-Aware Trader — Philosophy & Mindset
Using trendlines and channels transforms how you view the market. Instead of asking “Where will the price go?”, you begin to ask “Where is the price likely to react — or break out?”- You treat the chart as terrain, not as a random scatter of numbers. Channels give boundaries; price moves within, bounces off, or breaks out.
- You avoid trying to predict exact tops/bottoms — instead, you respect structure: support, resistance, trend flow.
- You plan entries, exits, and risk around zones, not random guesses.